Membership Demographics
ASA 2018 Demographic Survey
Question 1: My Membership Grade Is

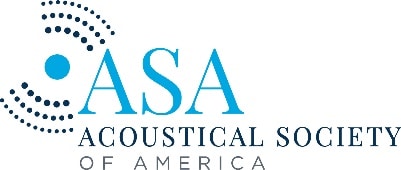
Question 2: Age Range
Question 3: Highest Degree Earned

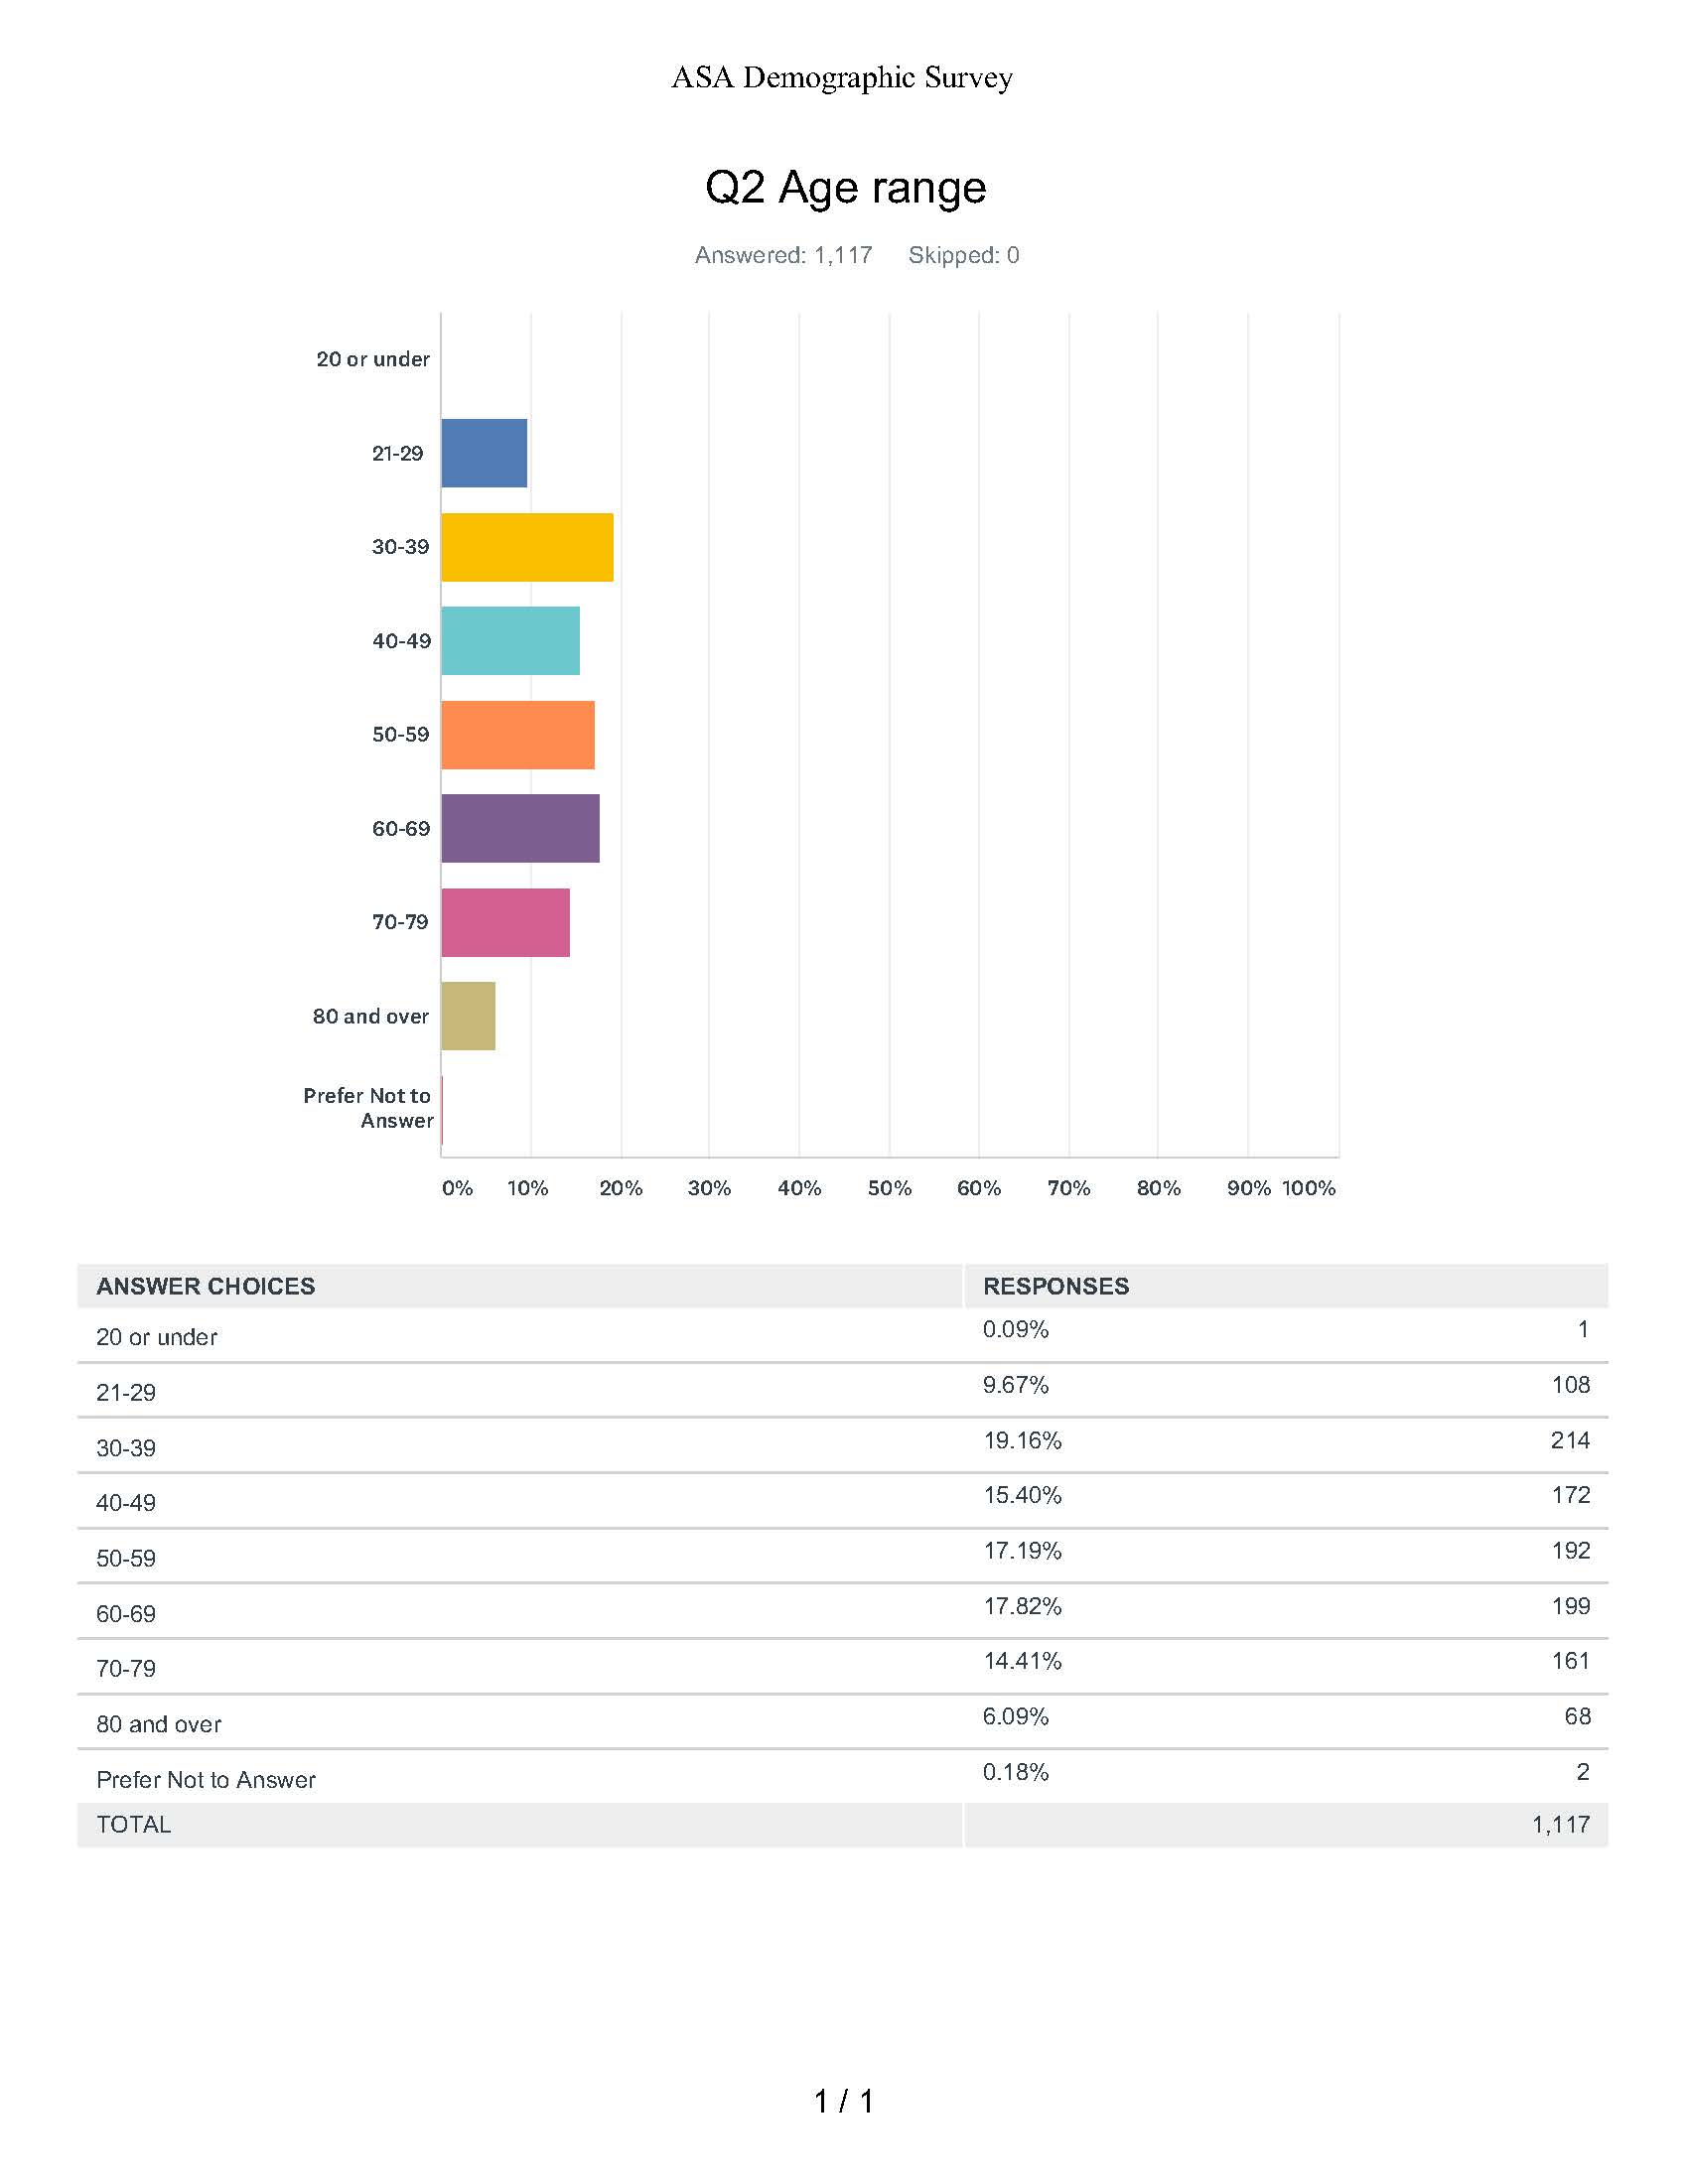
Question 4: Subject Area of Highest Degree
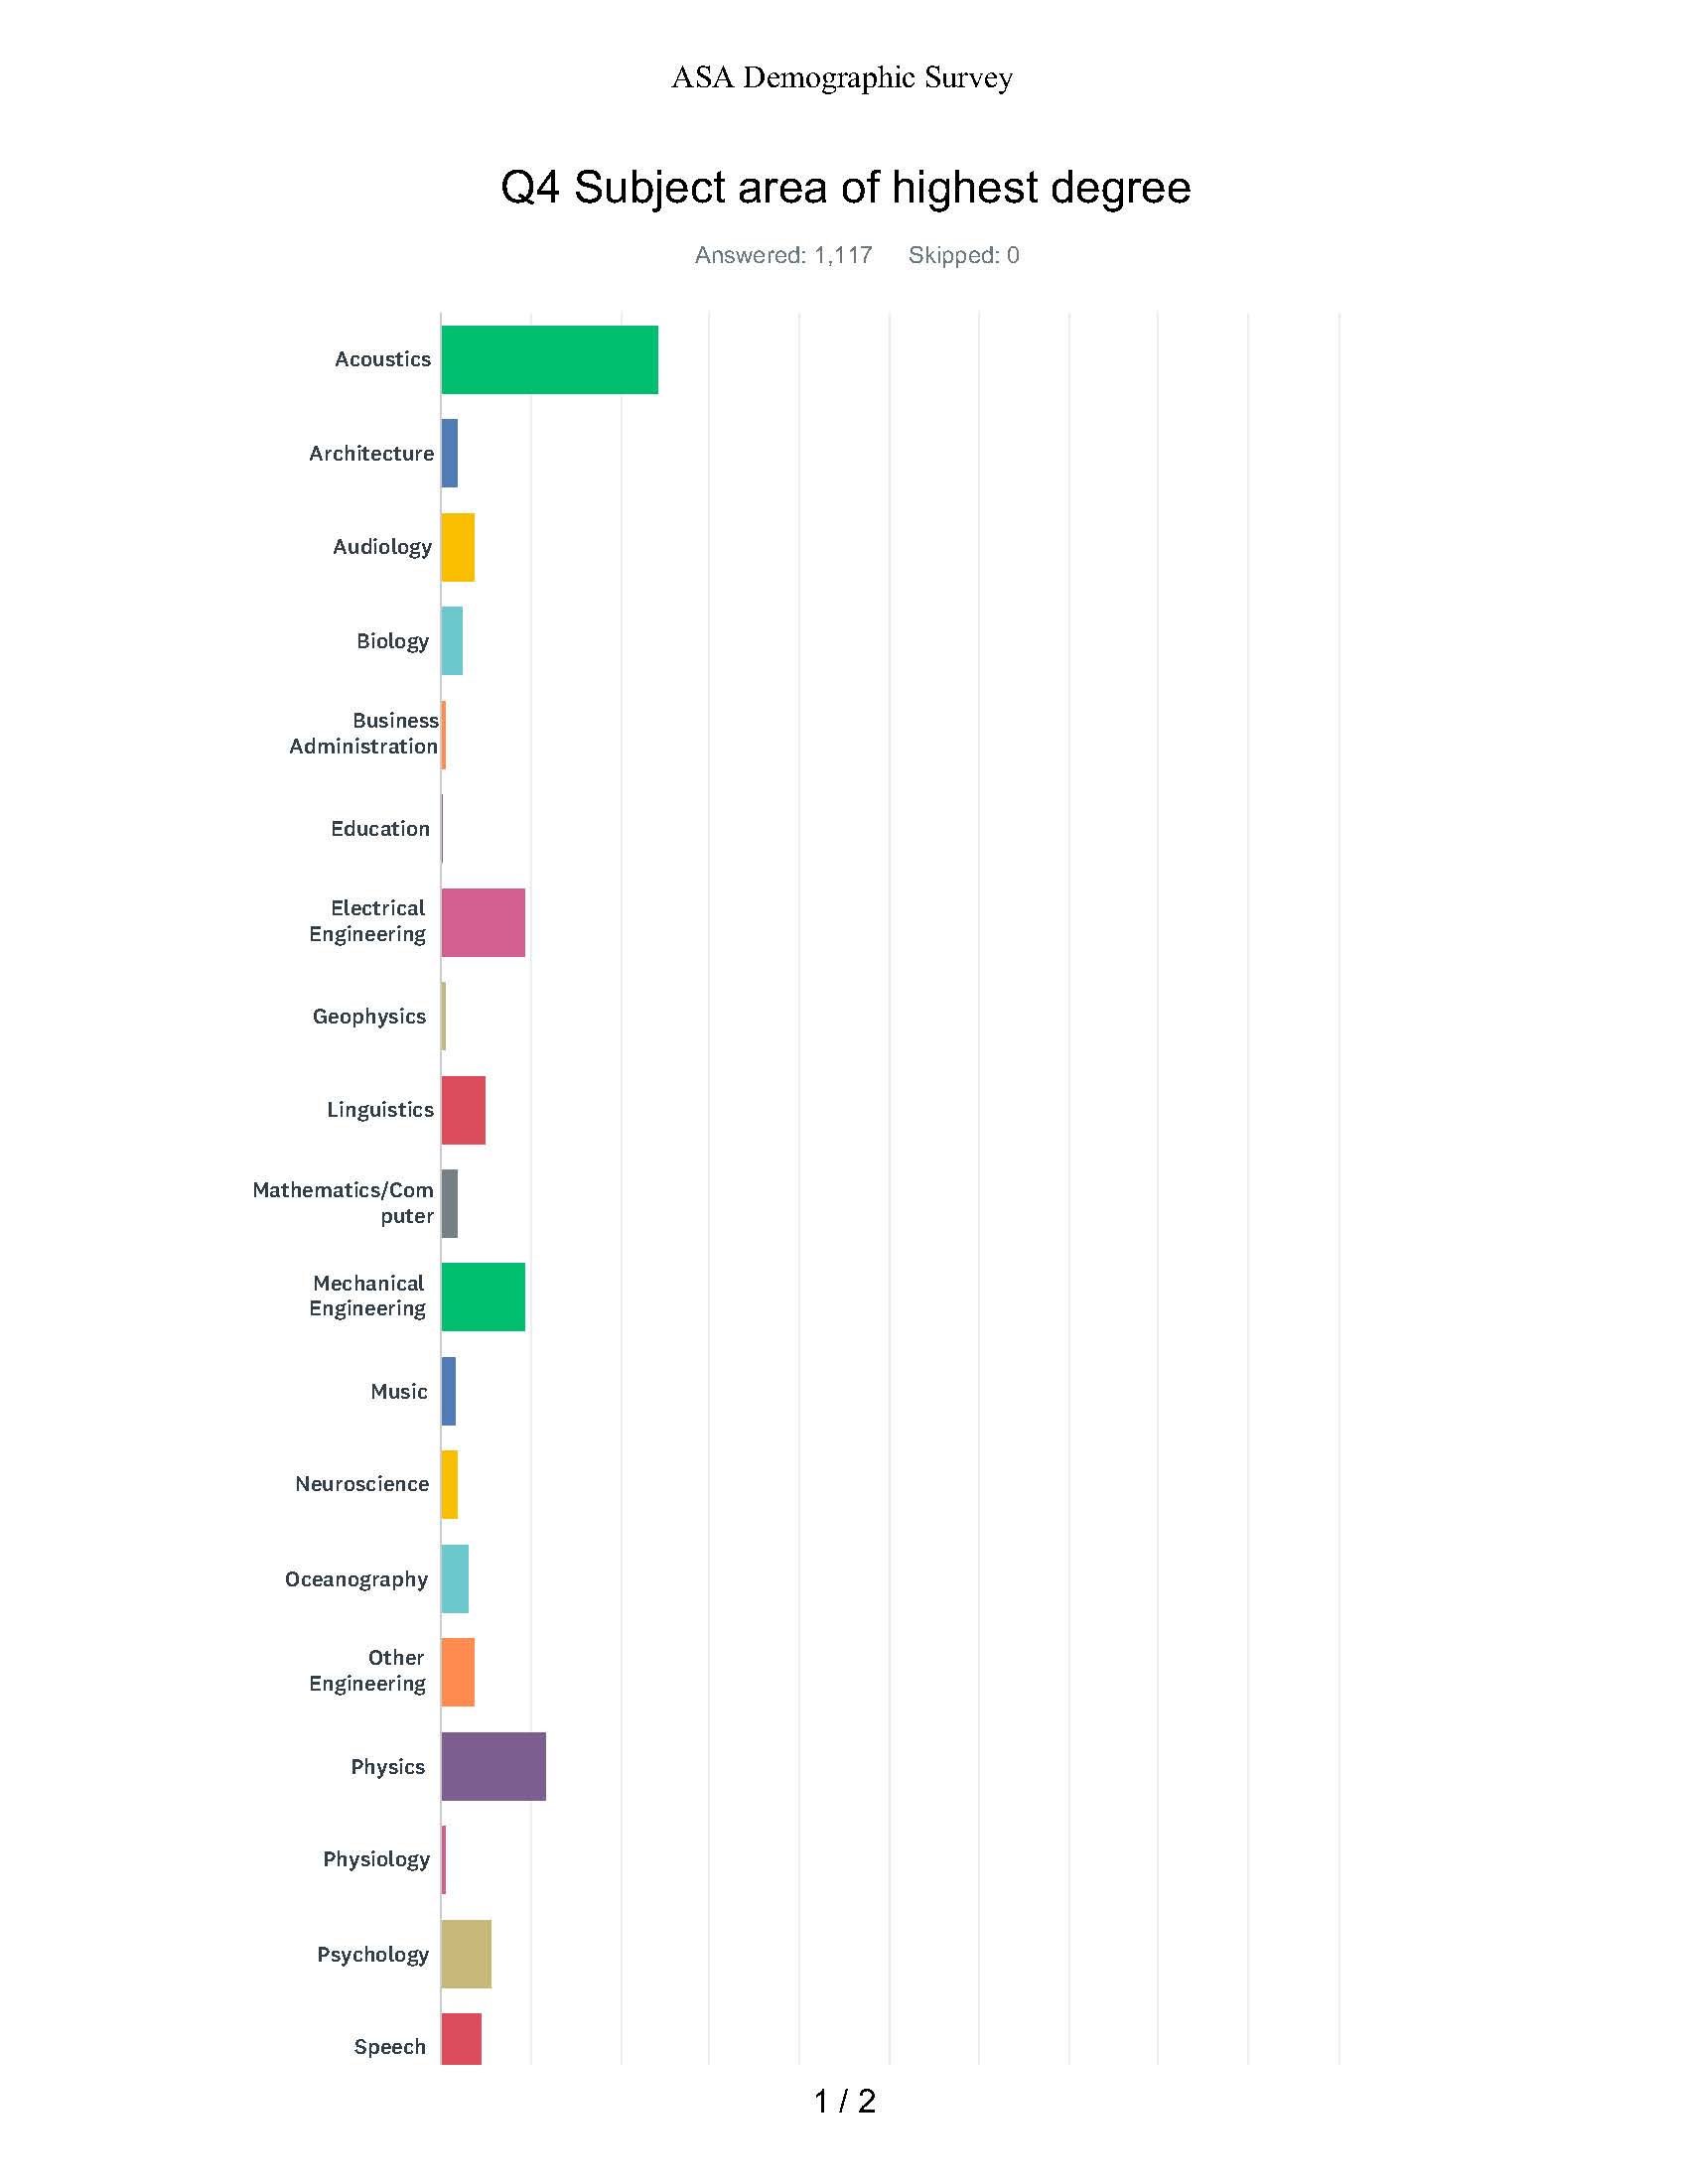

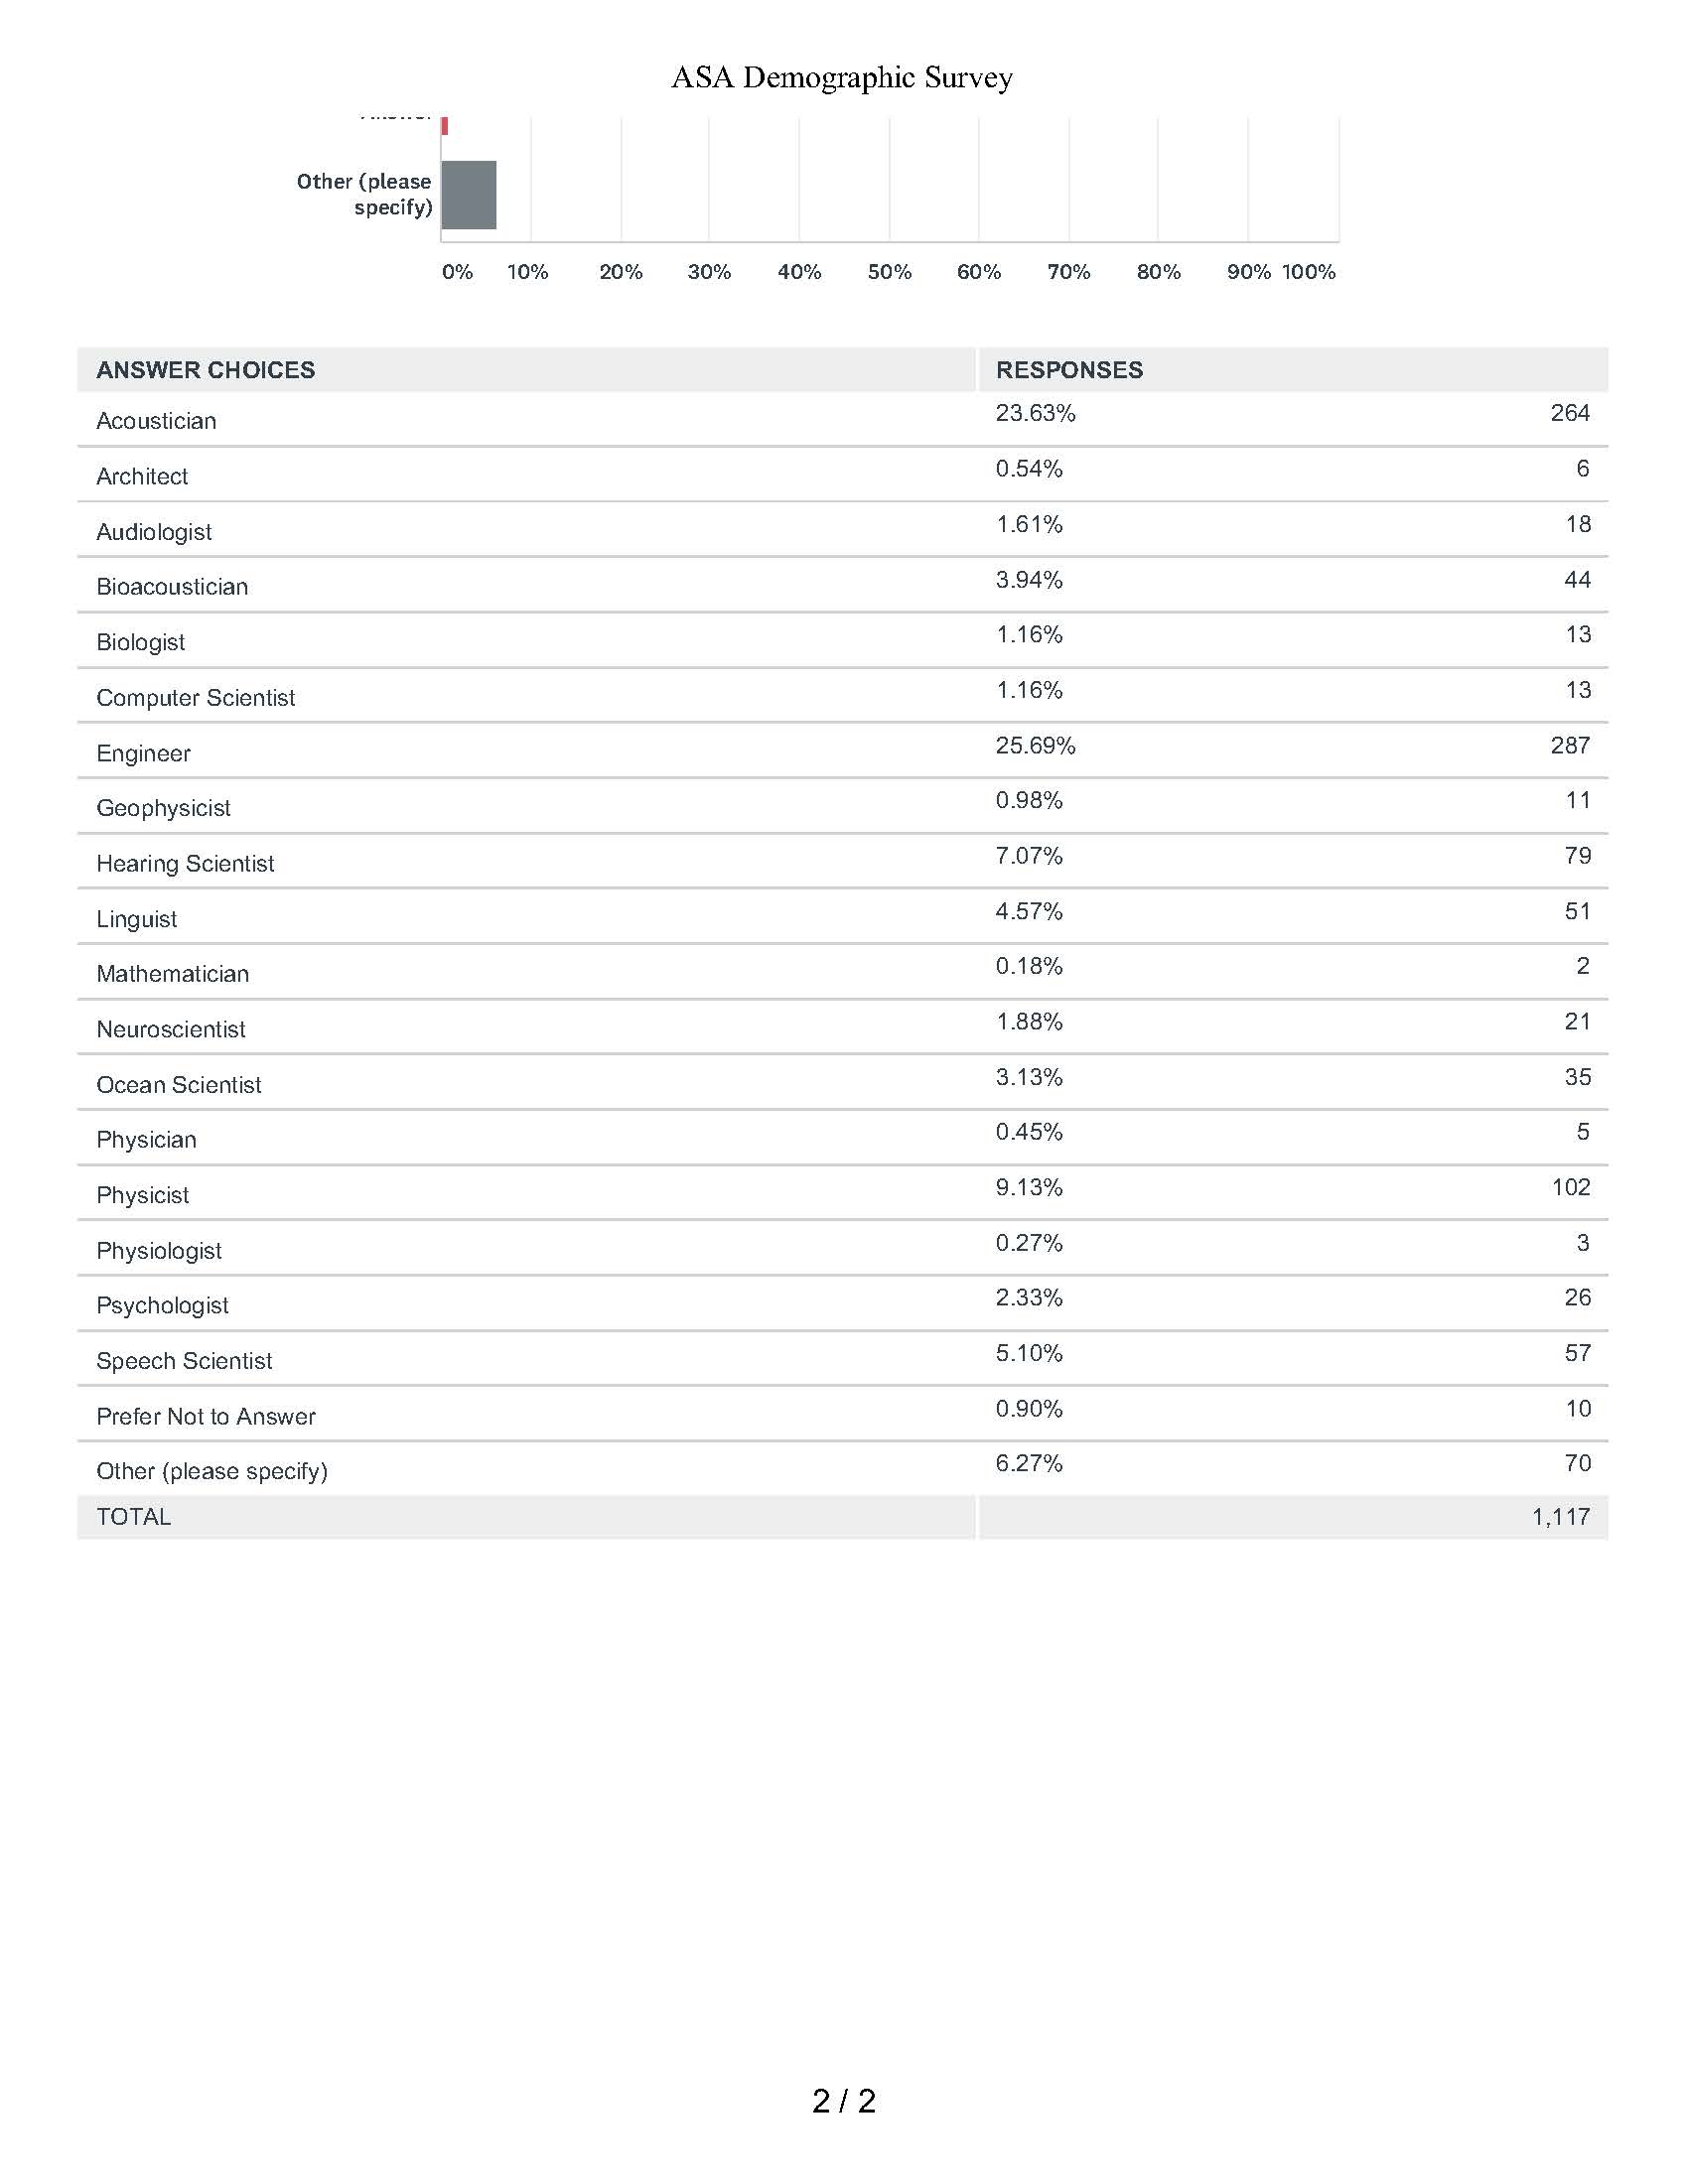
Question 5: Professional Identification
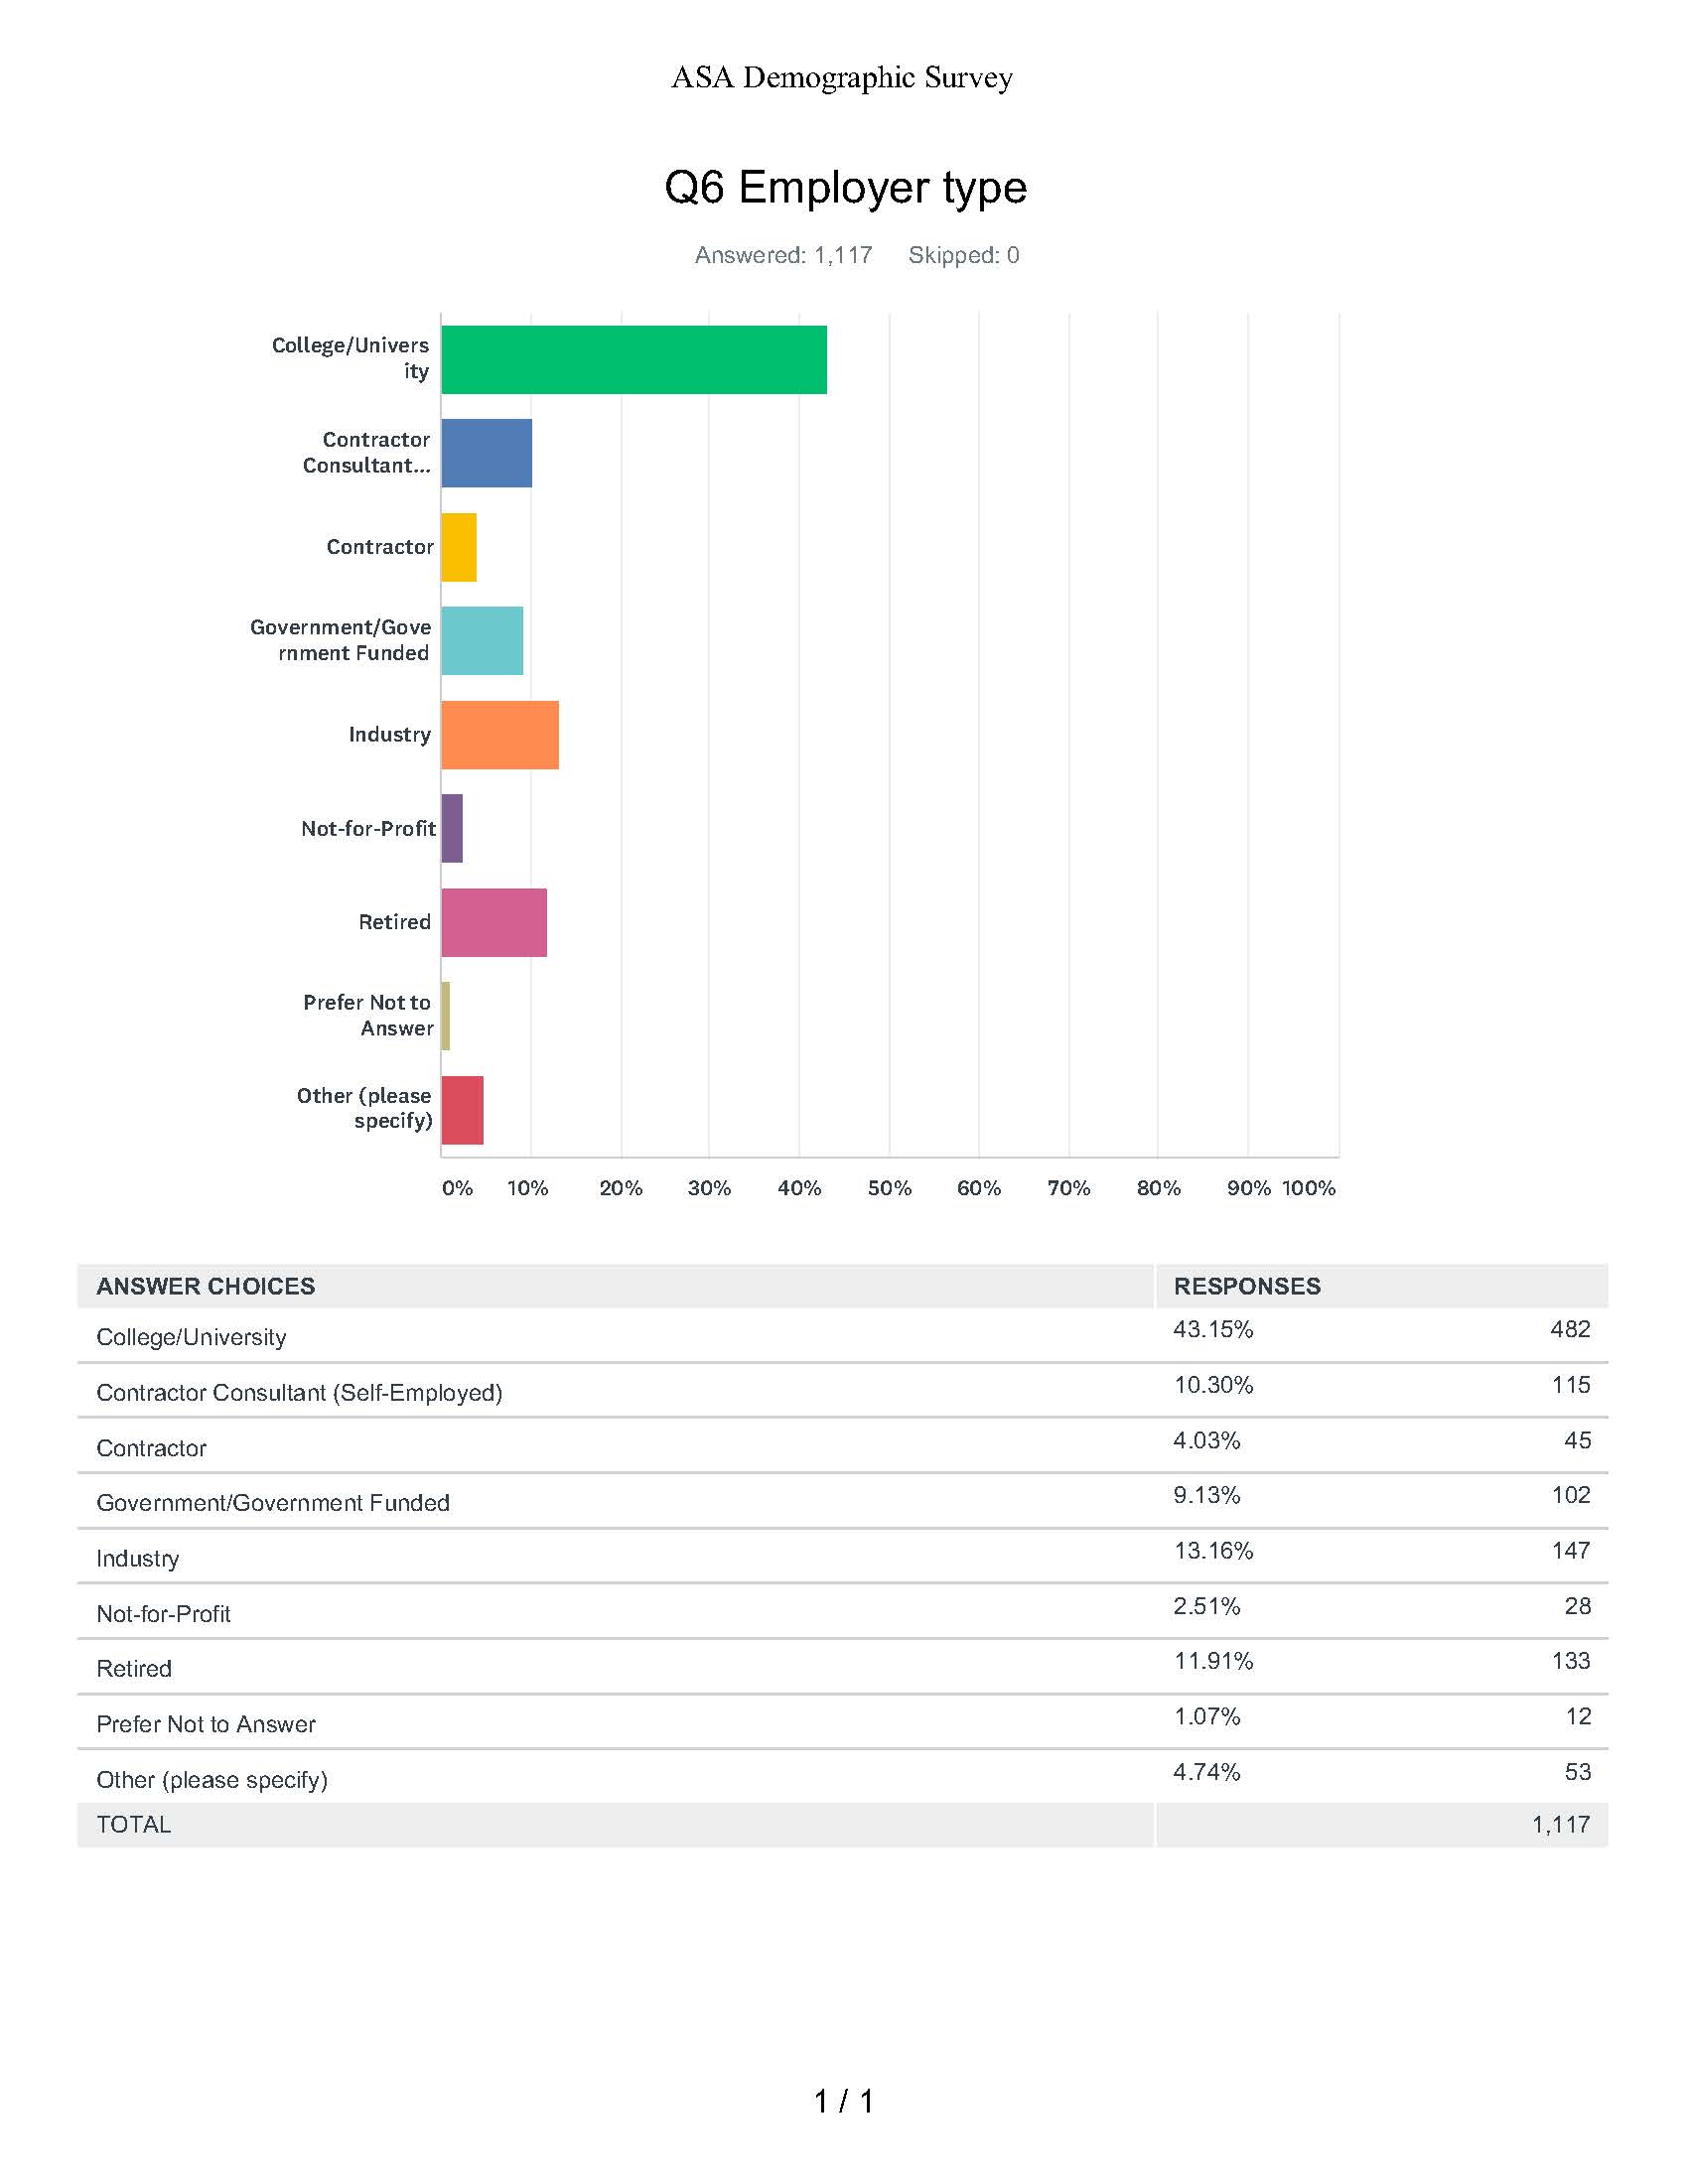
Question 6: Employer Type
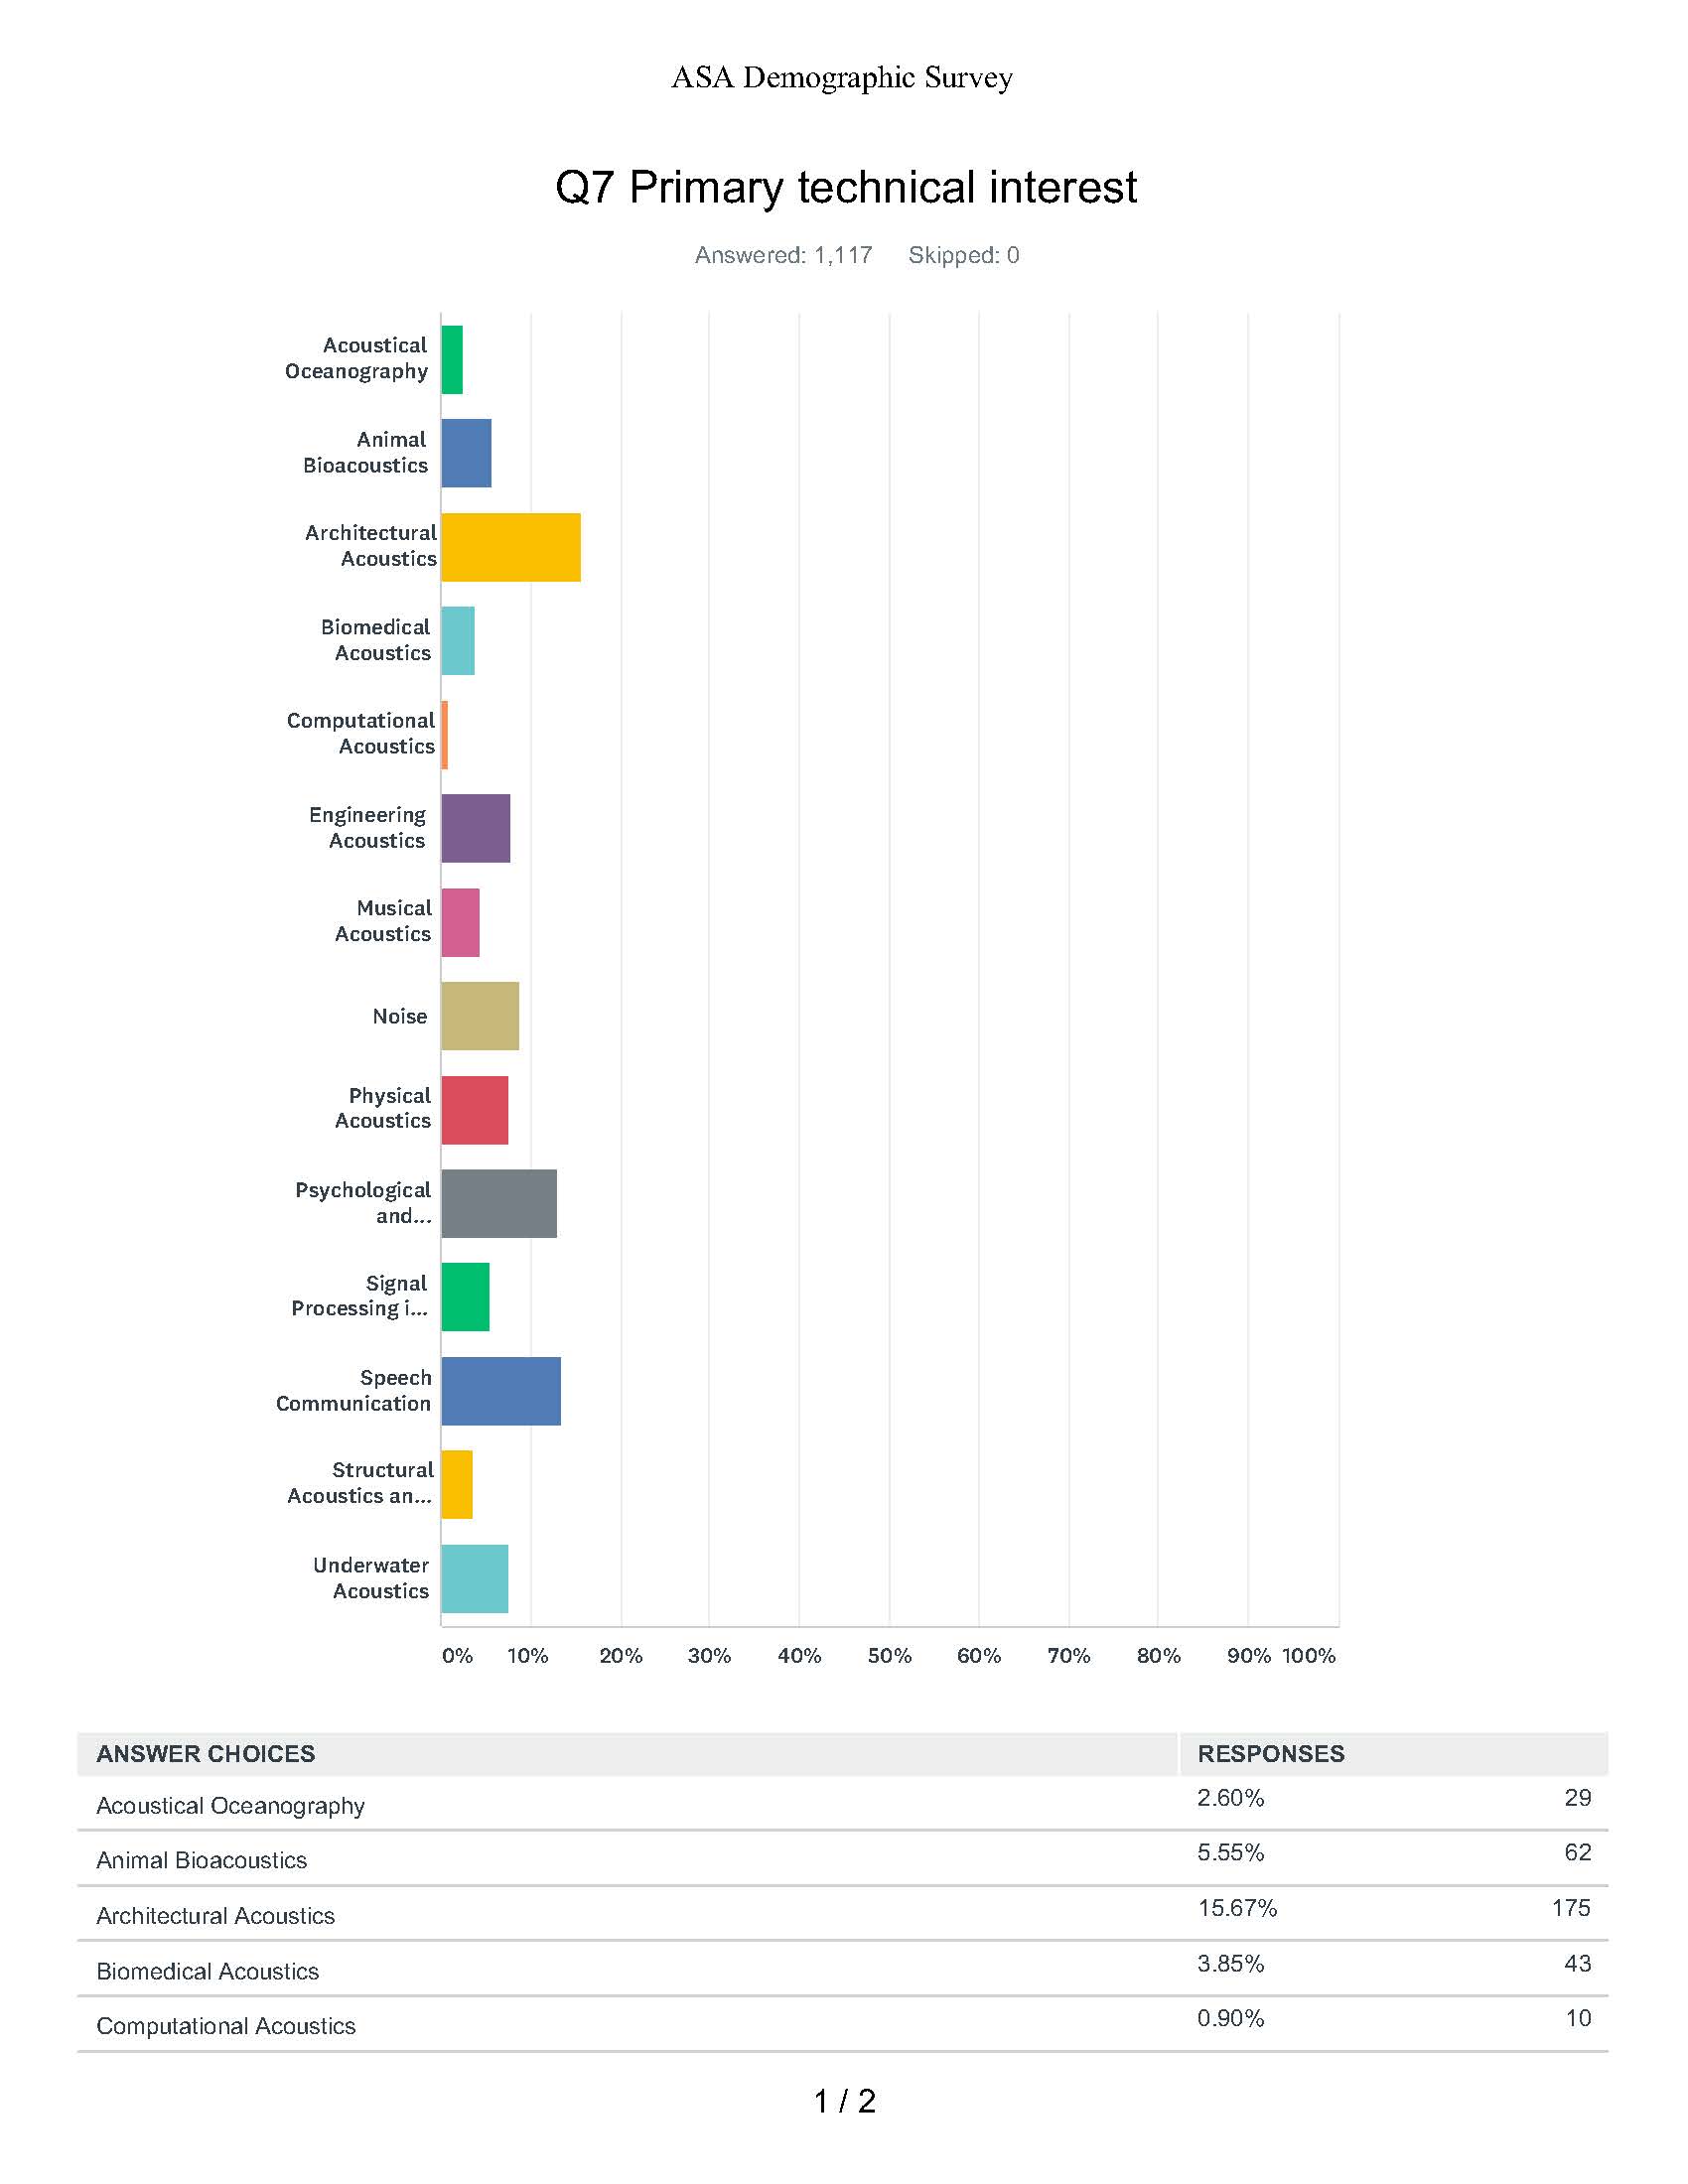
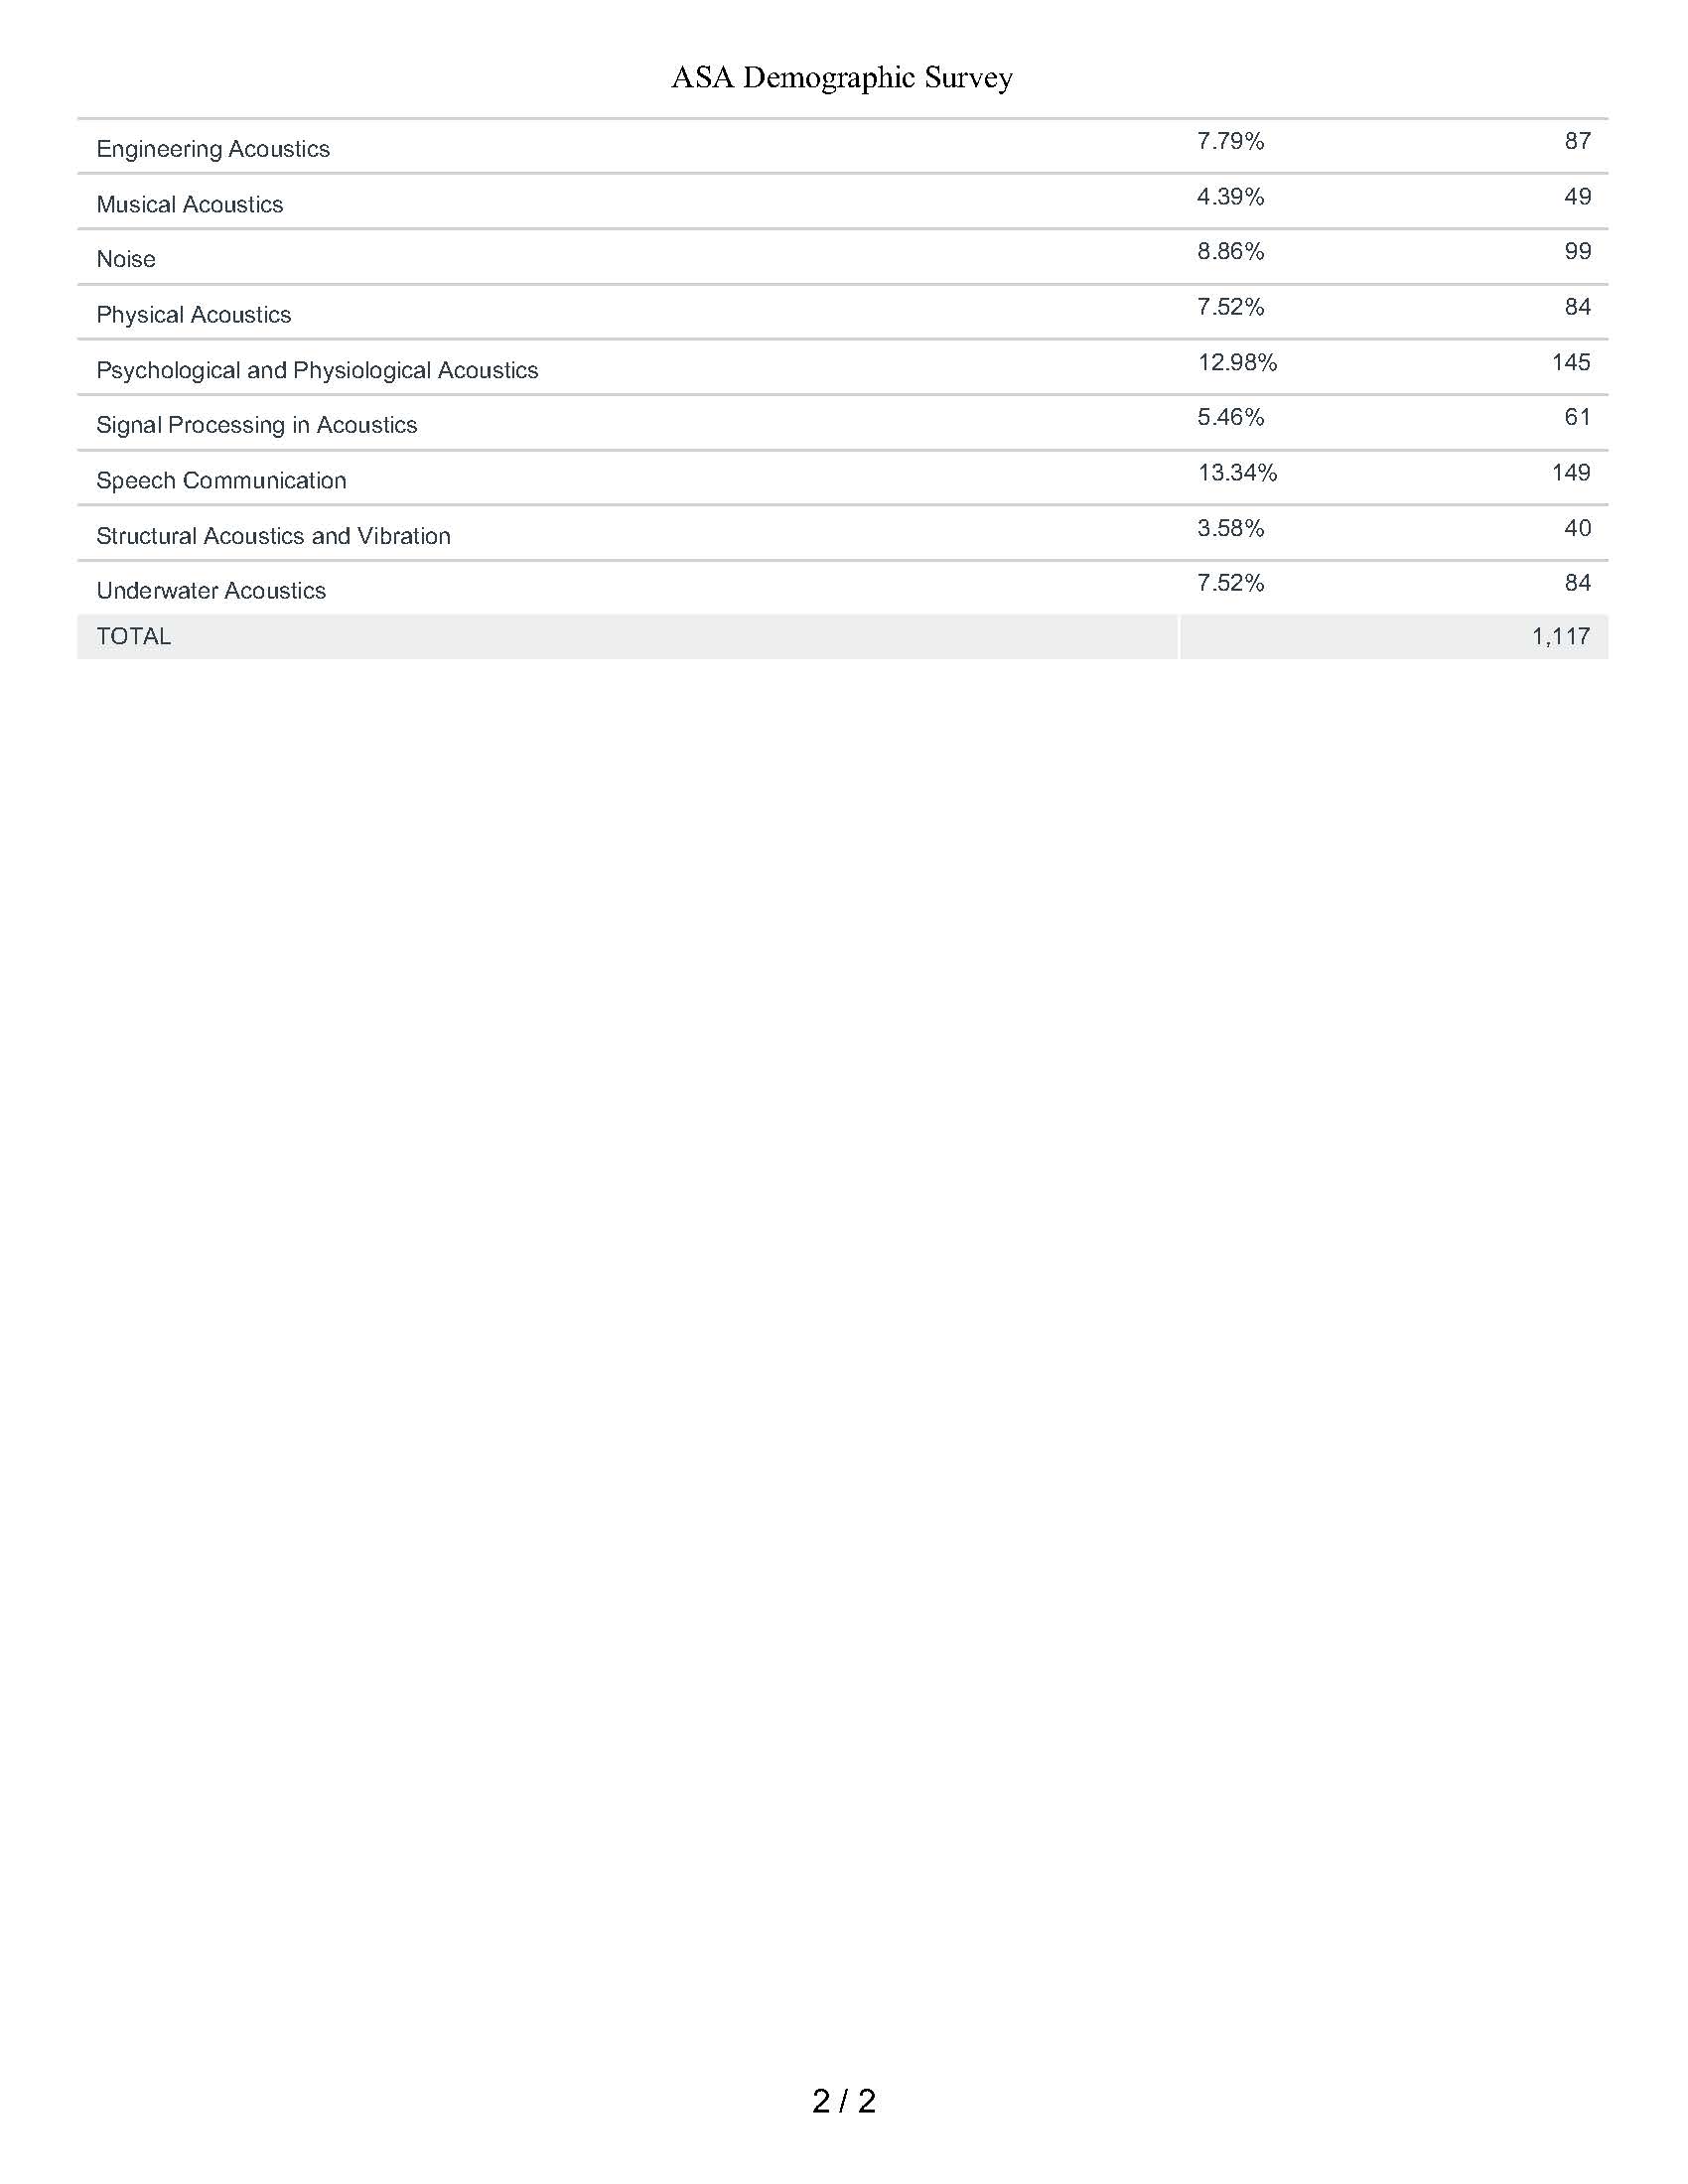
Question 7: Primary Technical Interest
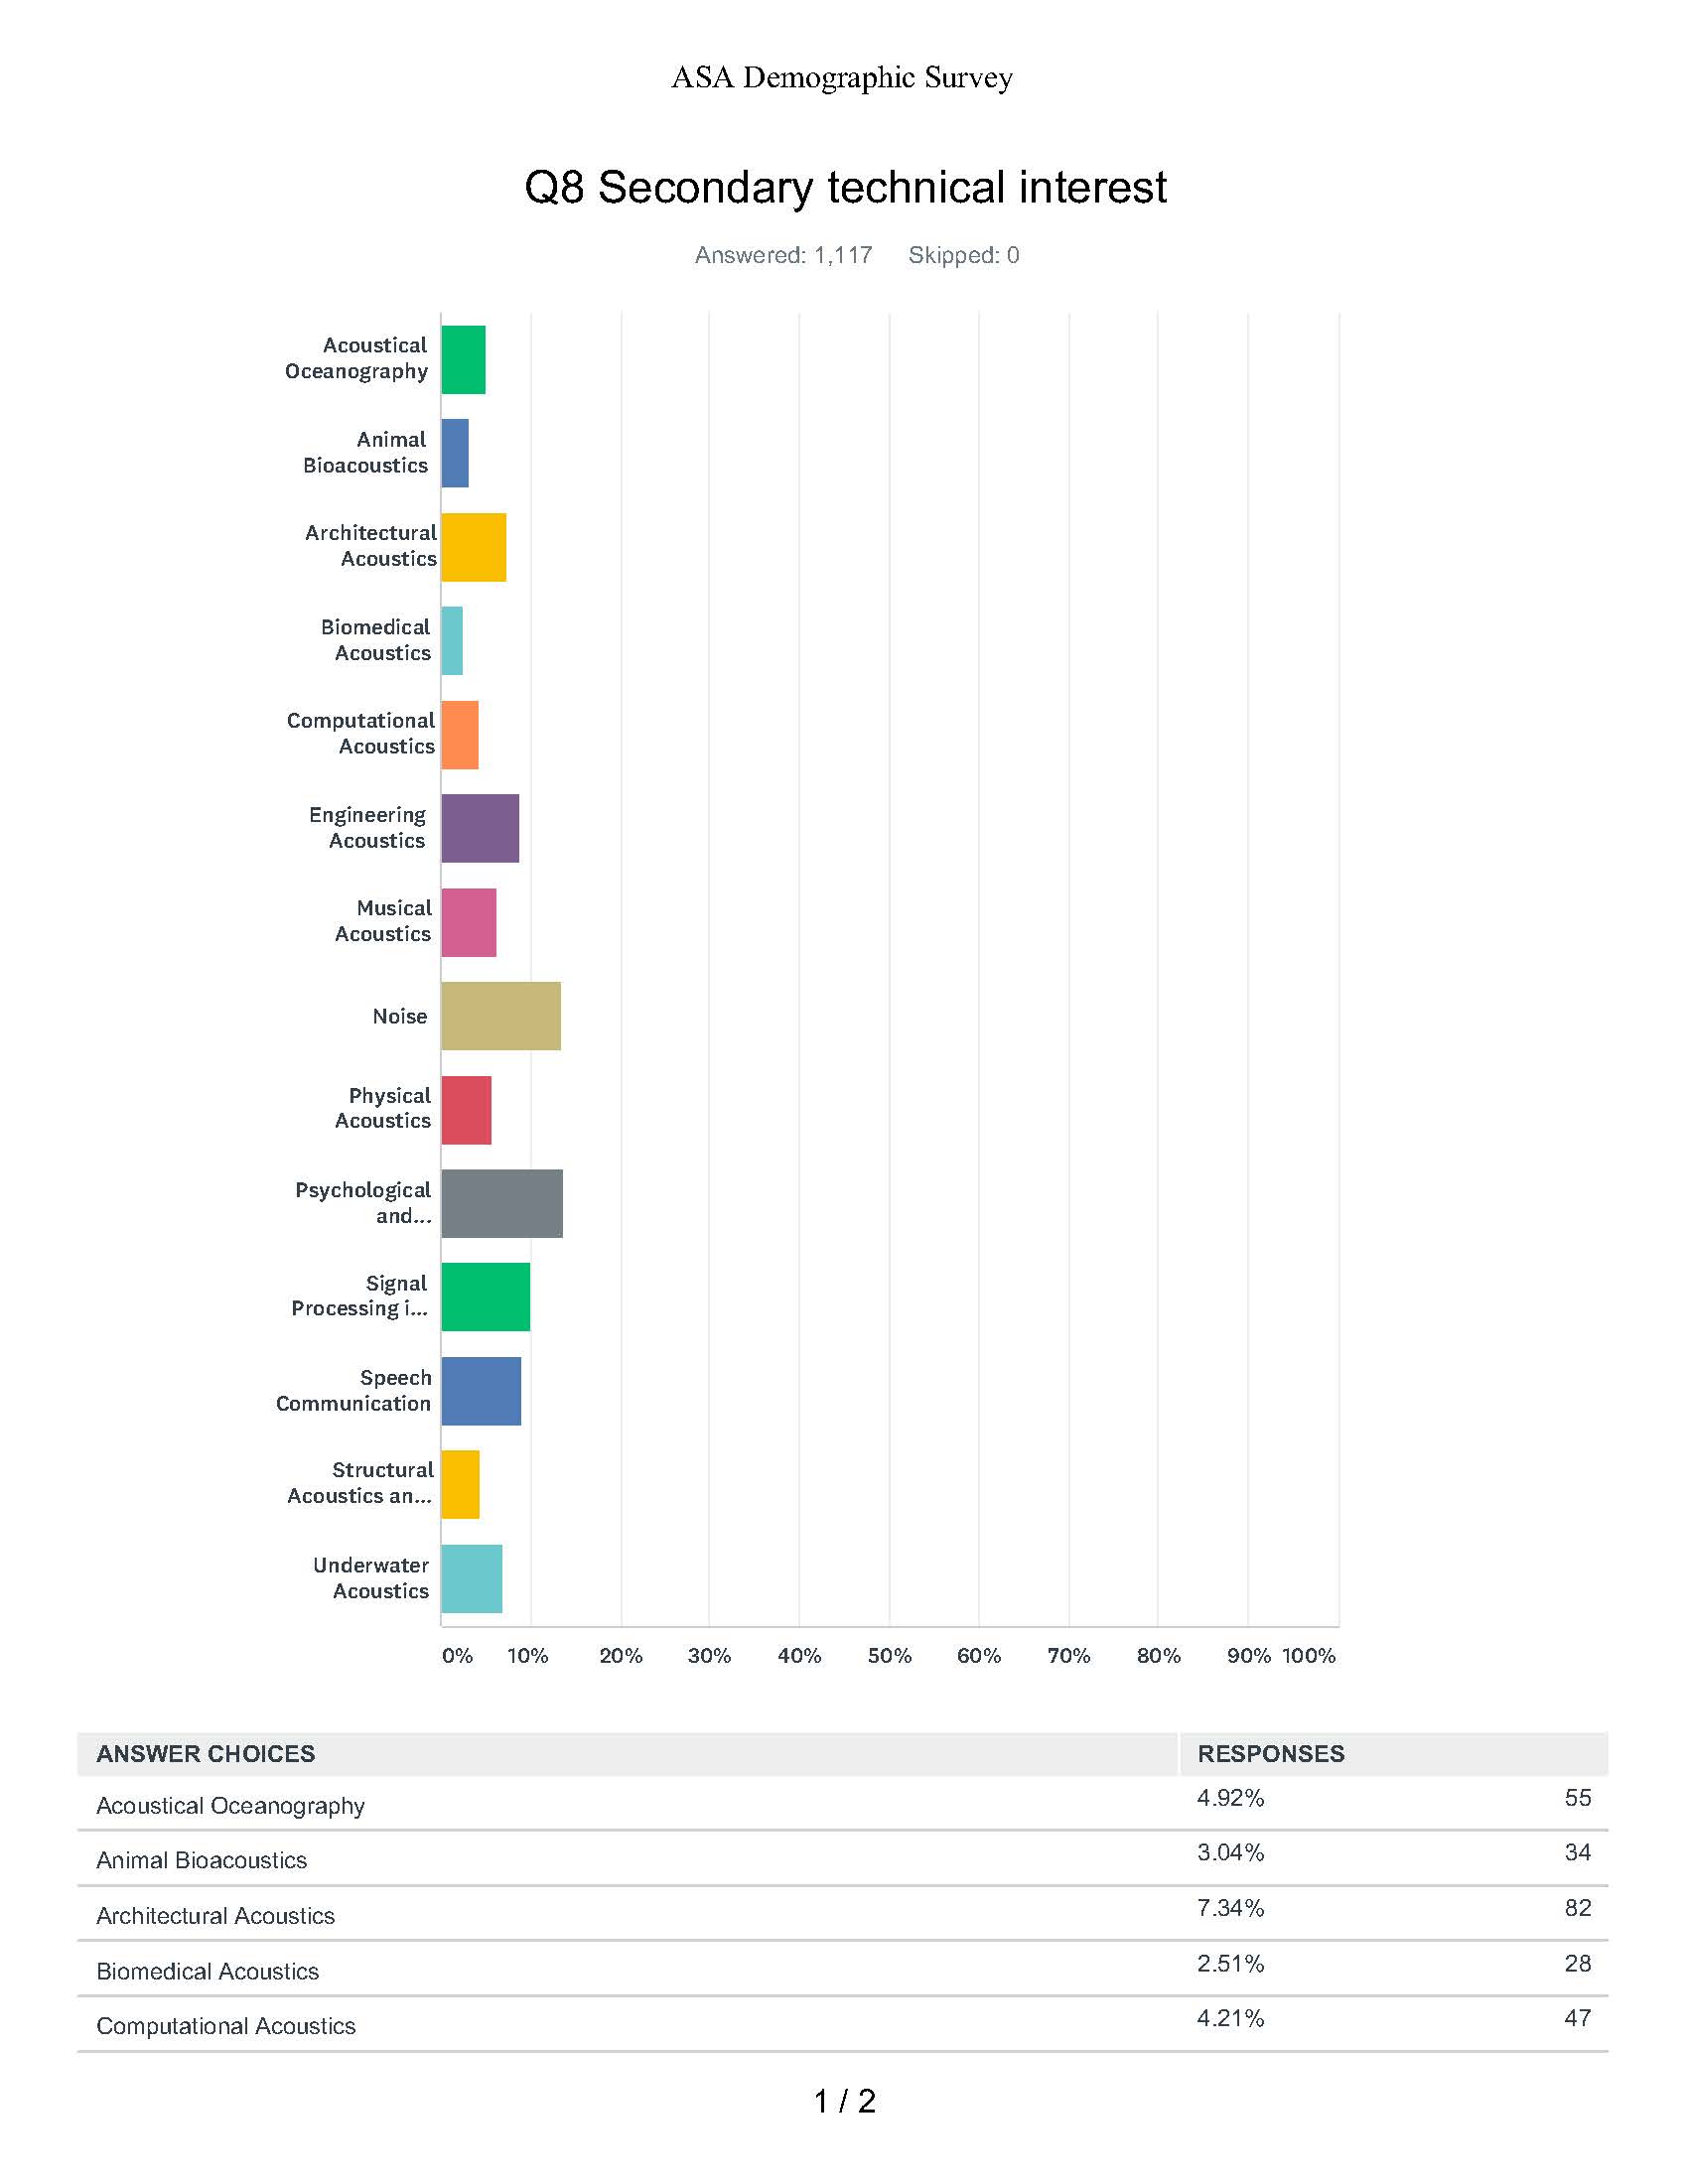
Question 8: Secondary Technical Interest

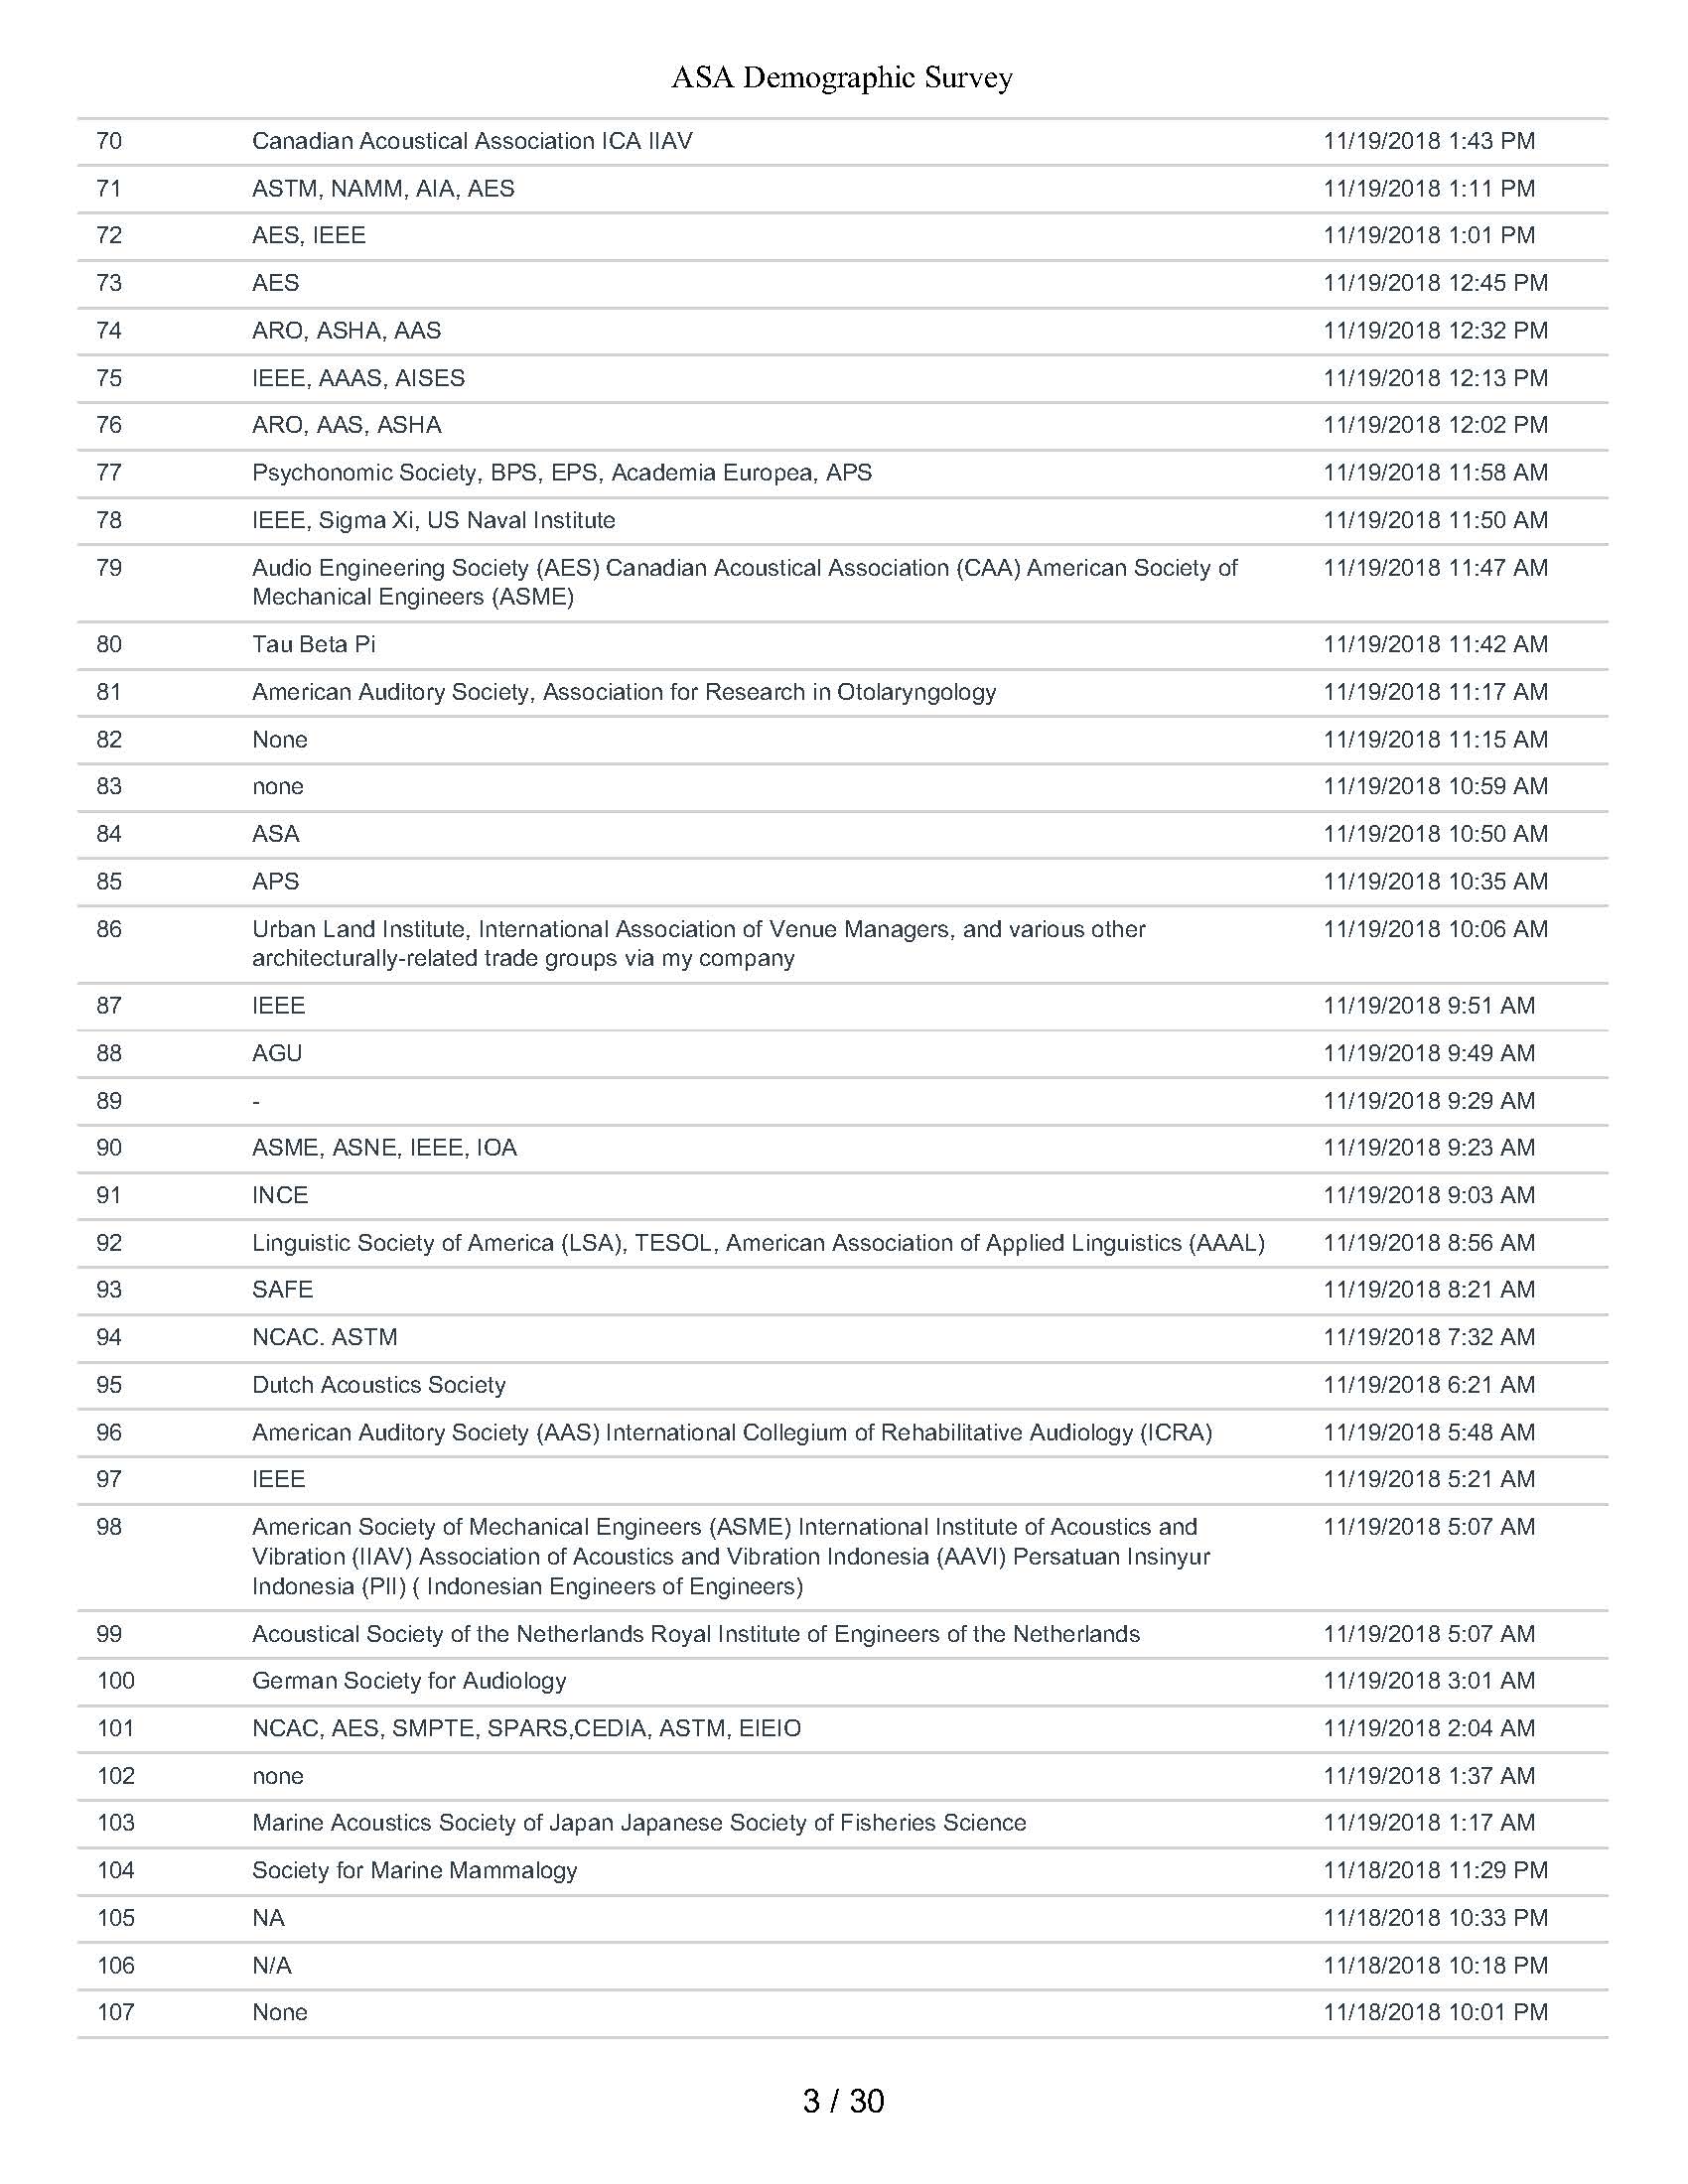
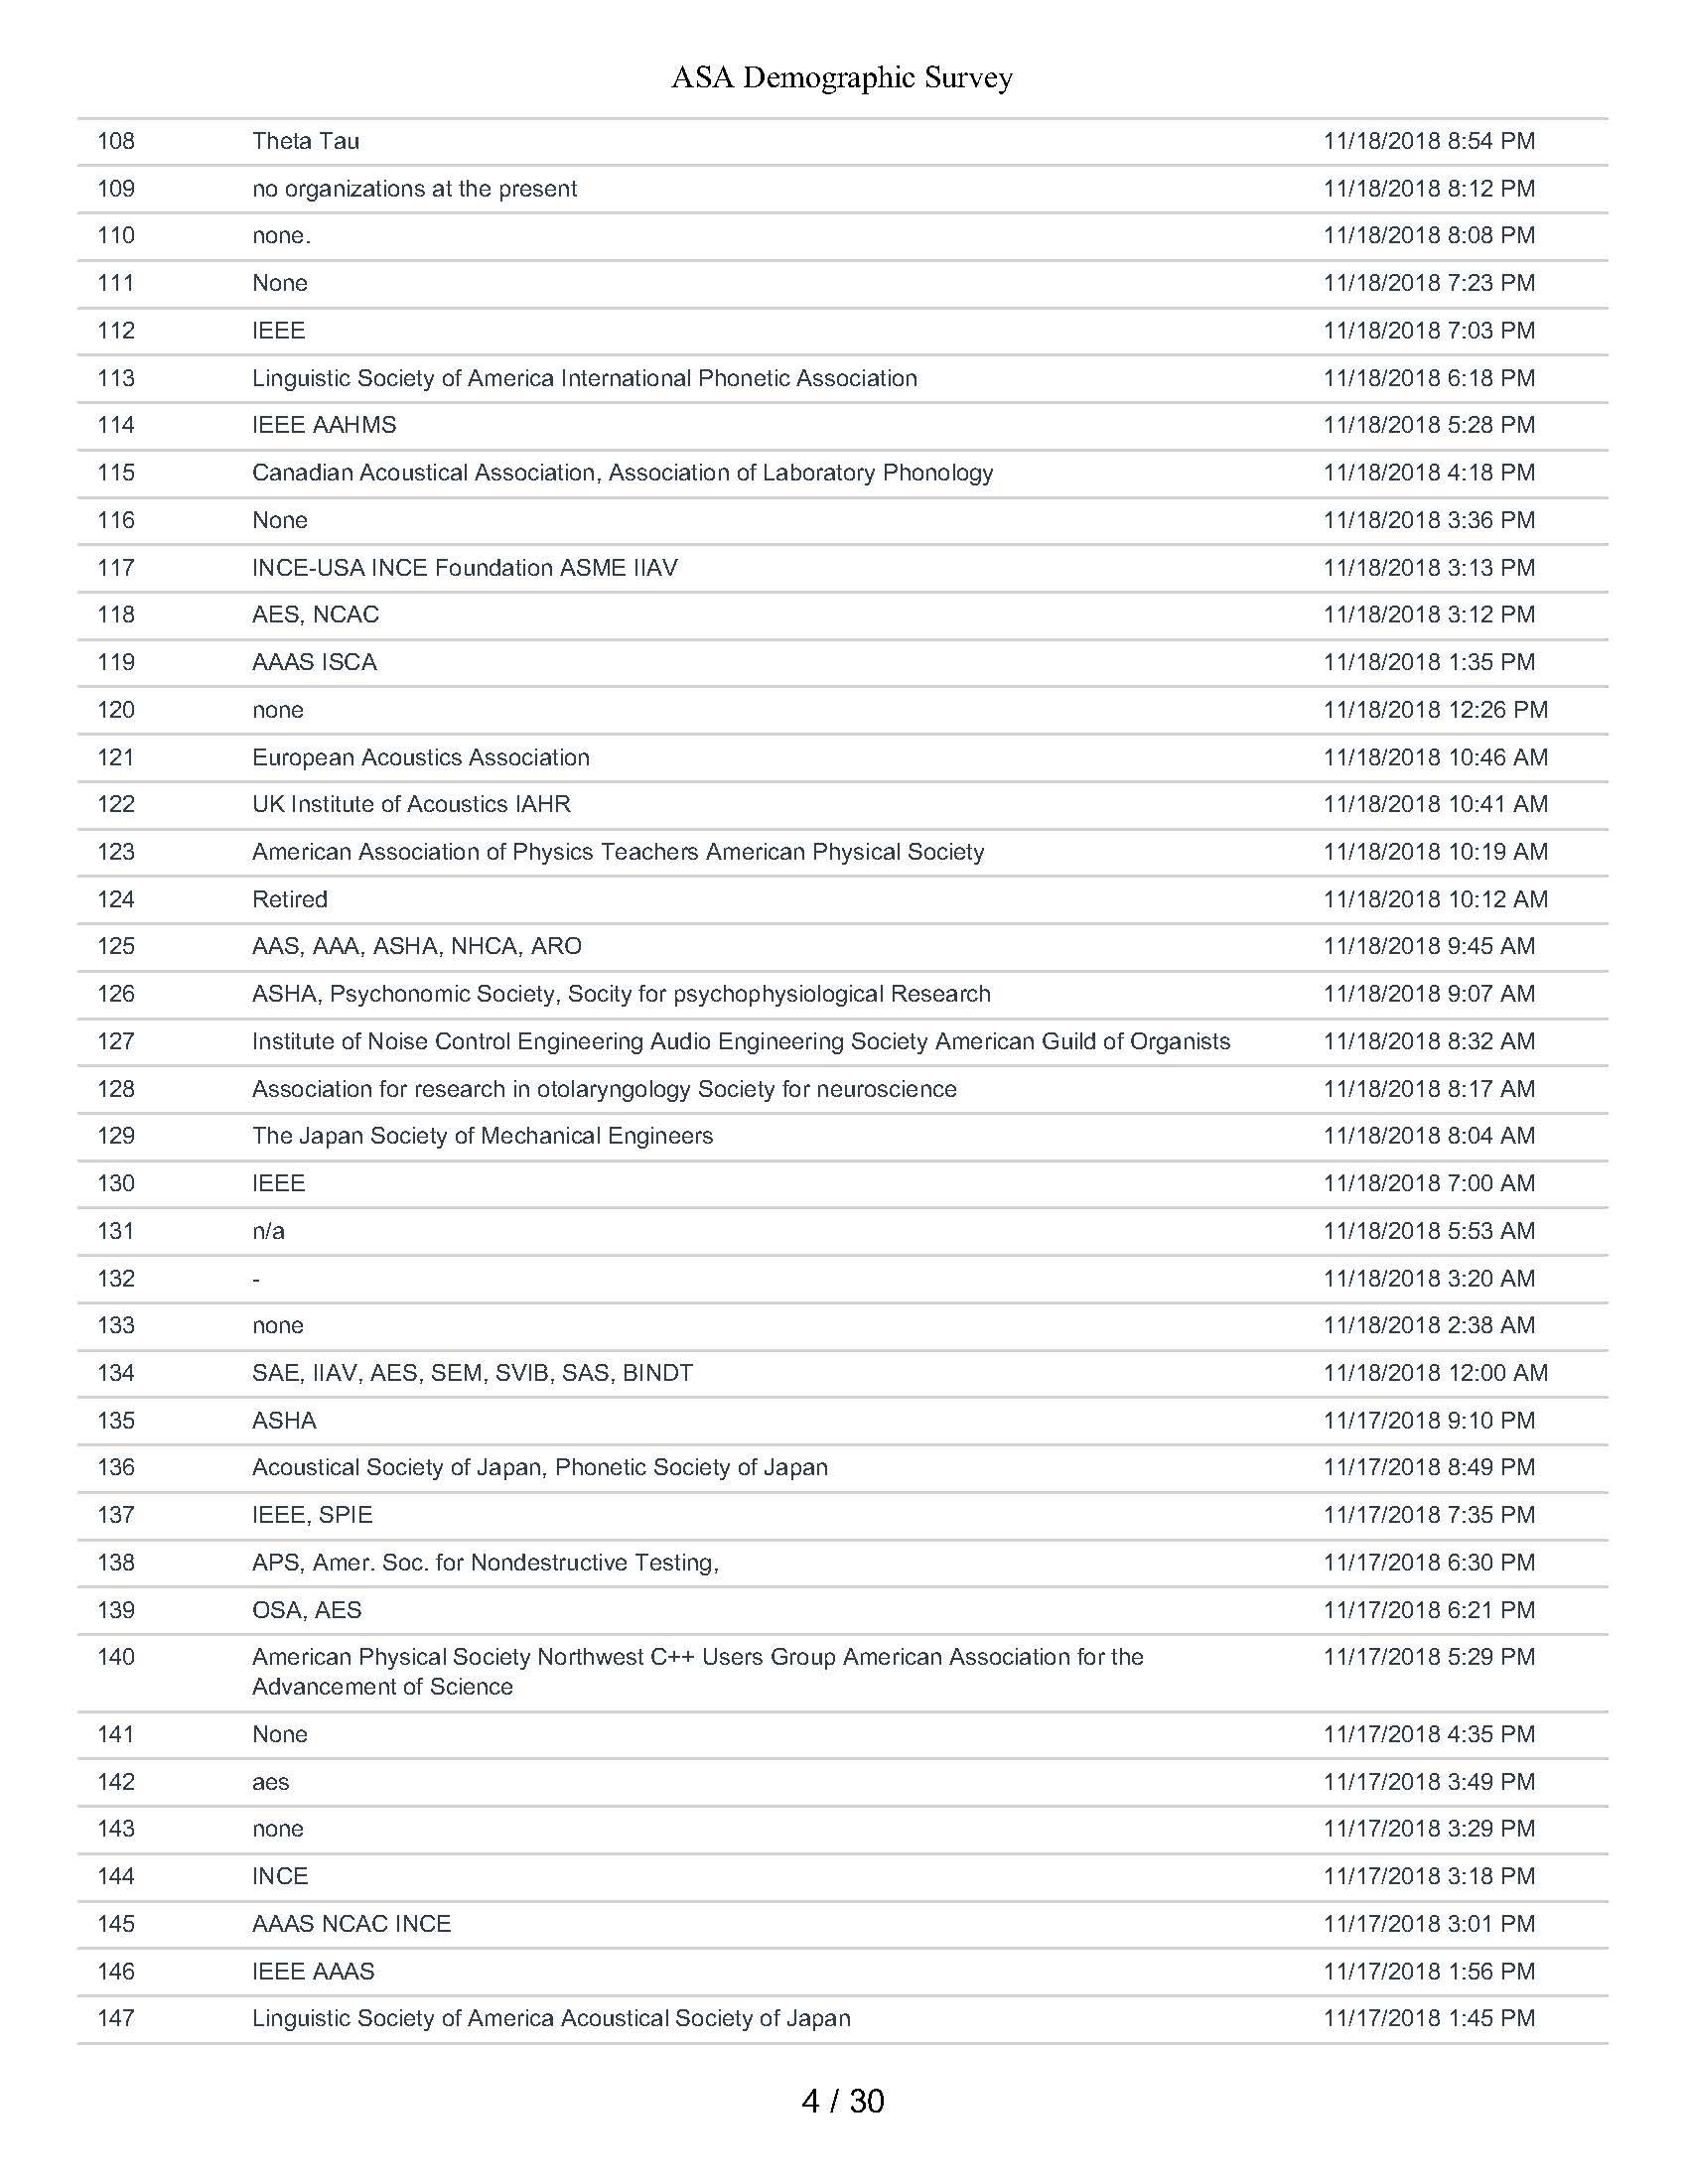
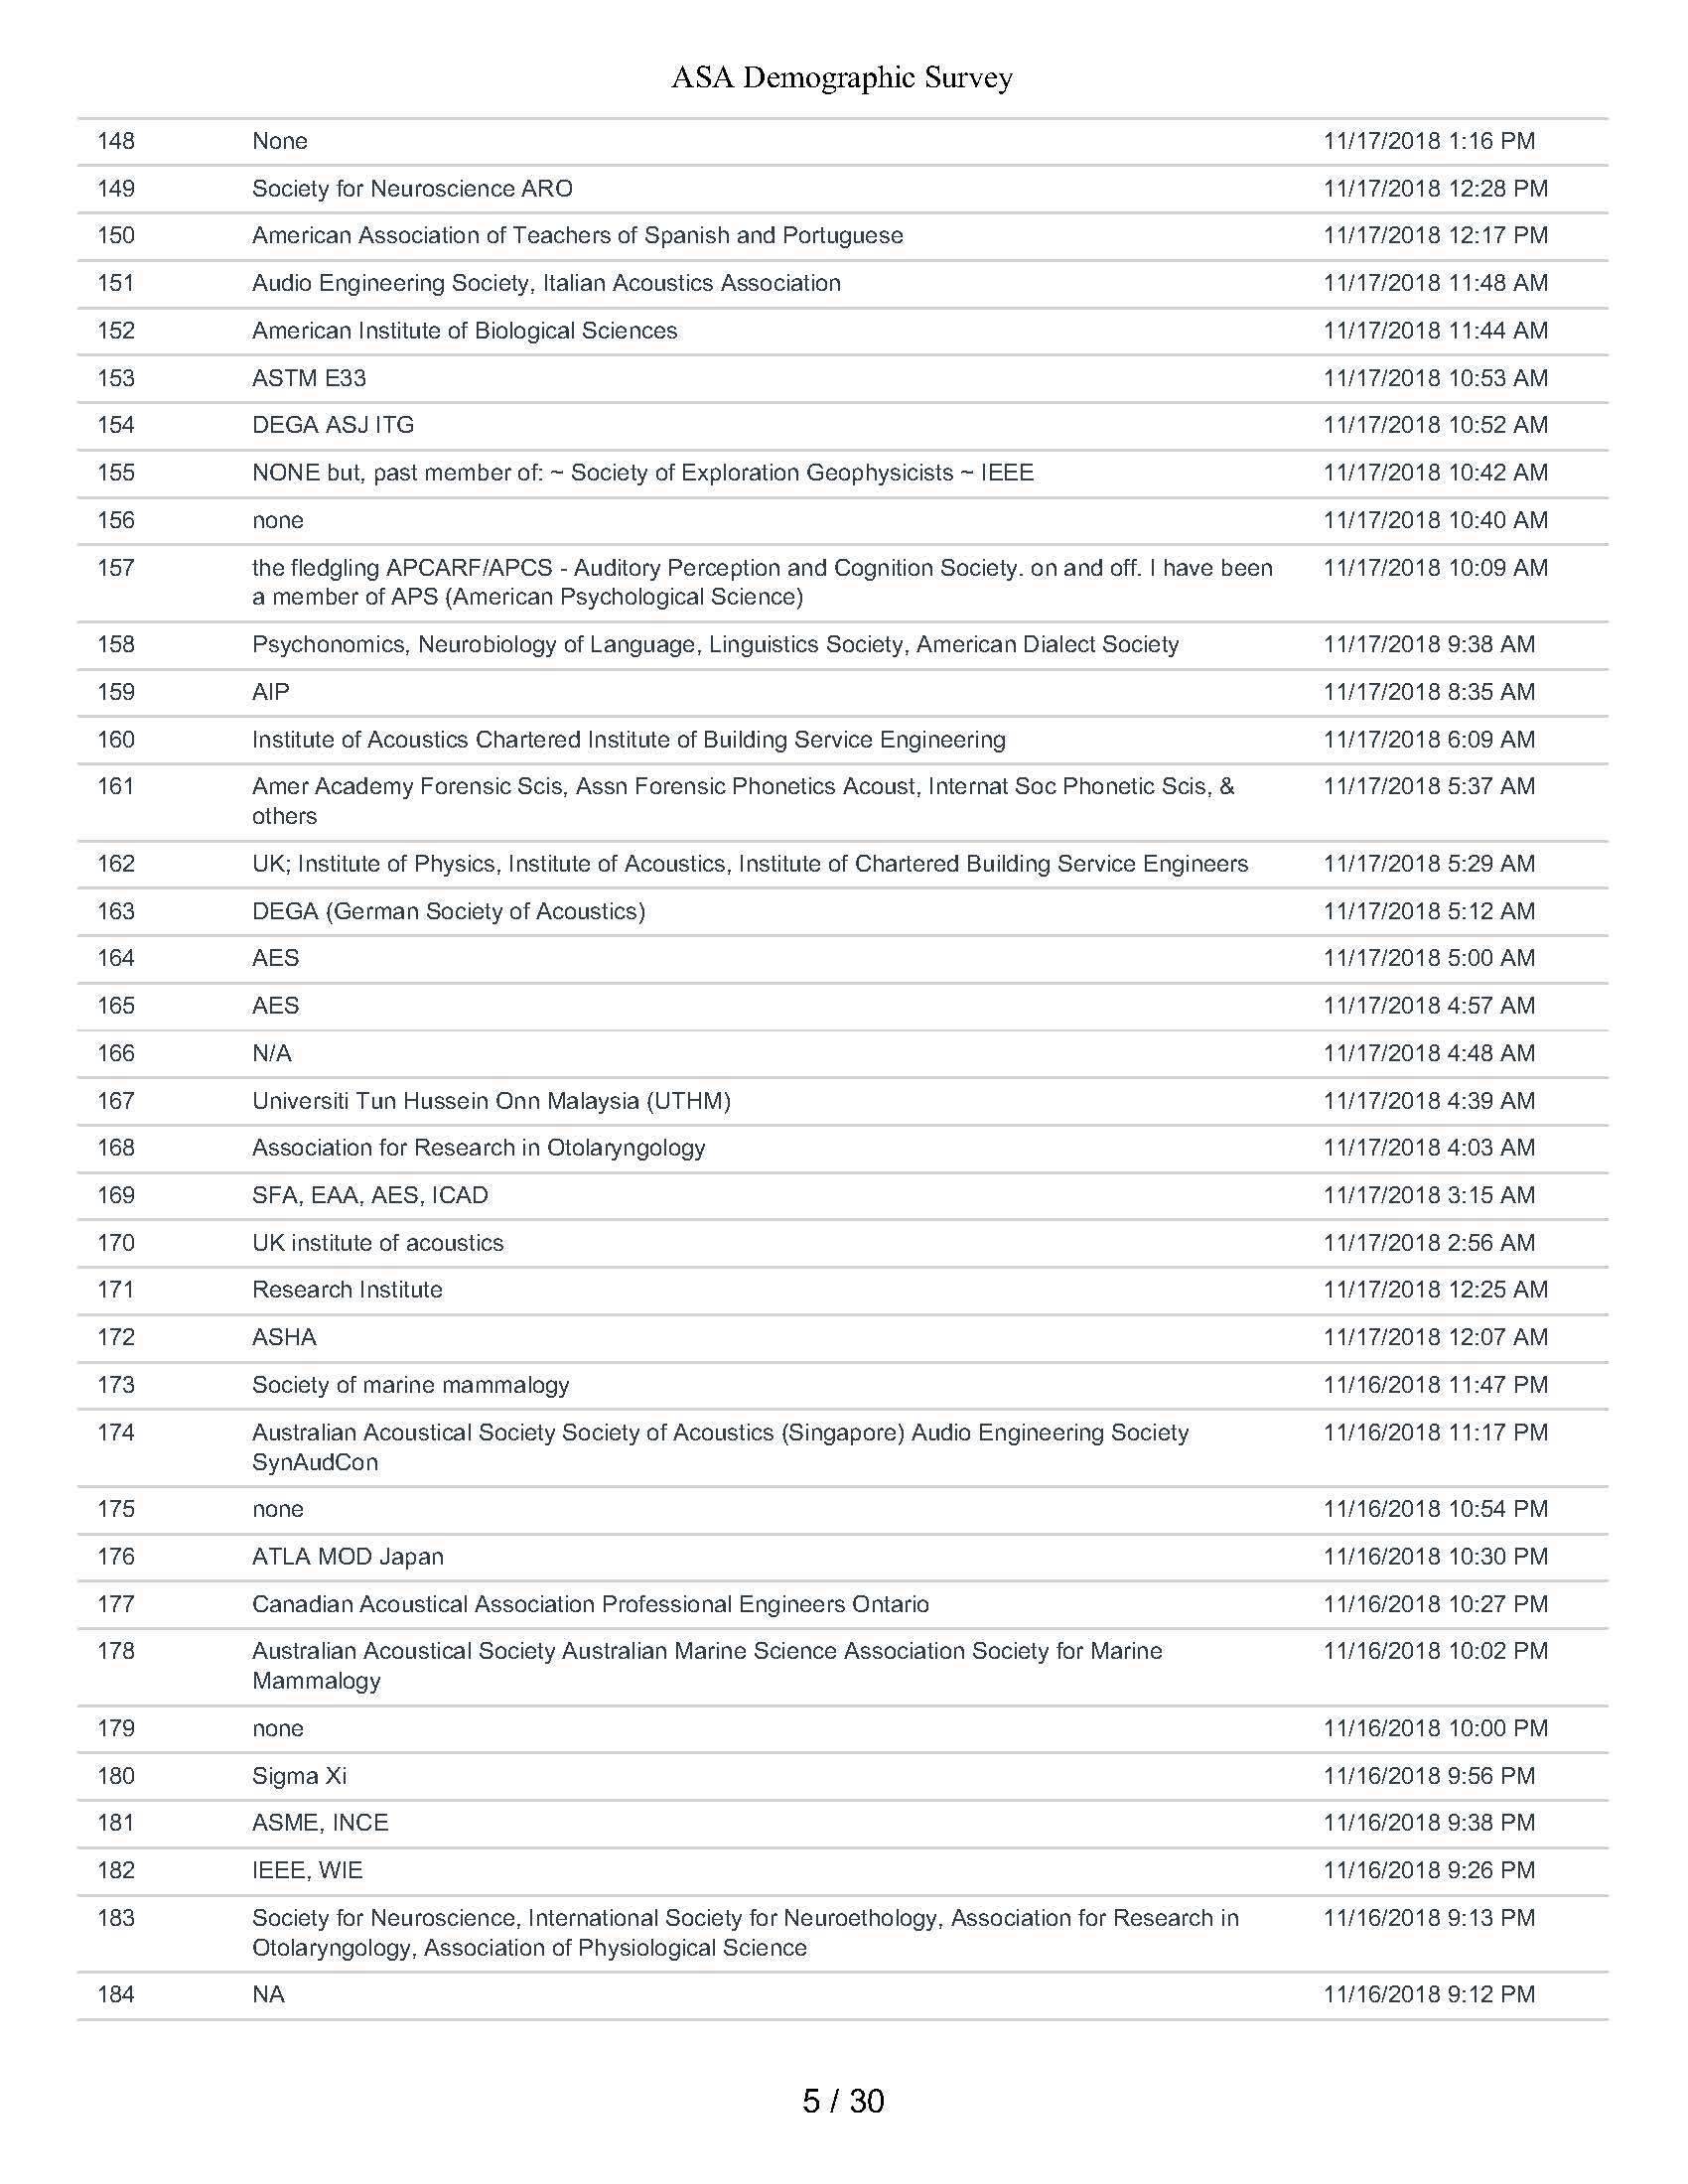
Question 9: What Other Professional Organizations Do You Belong To


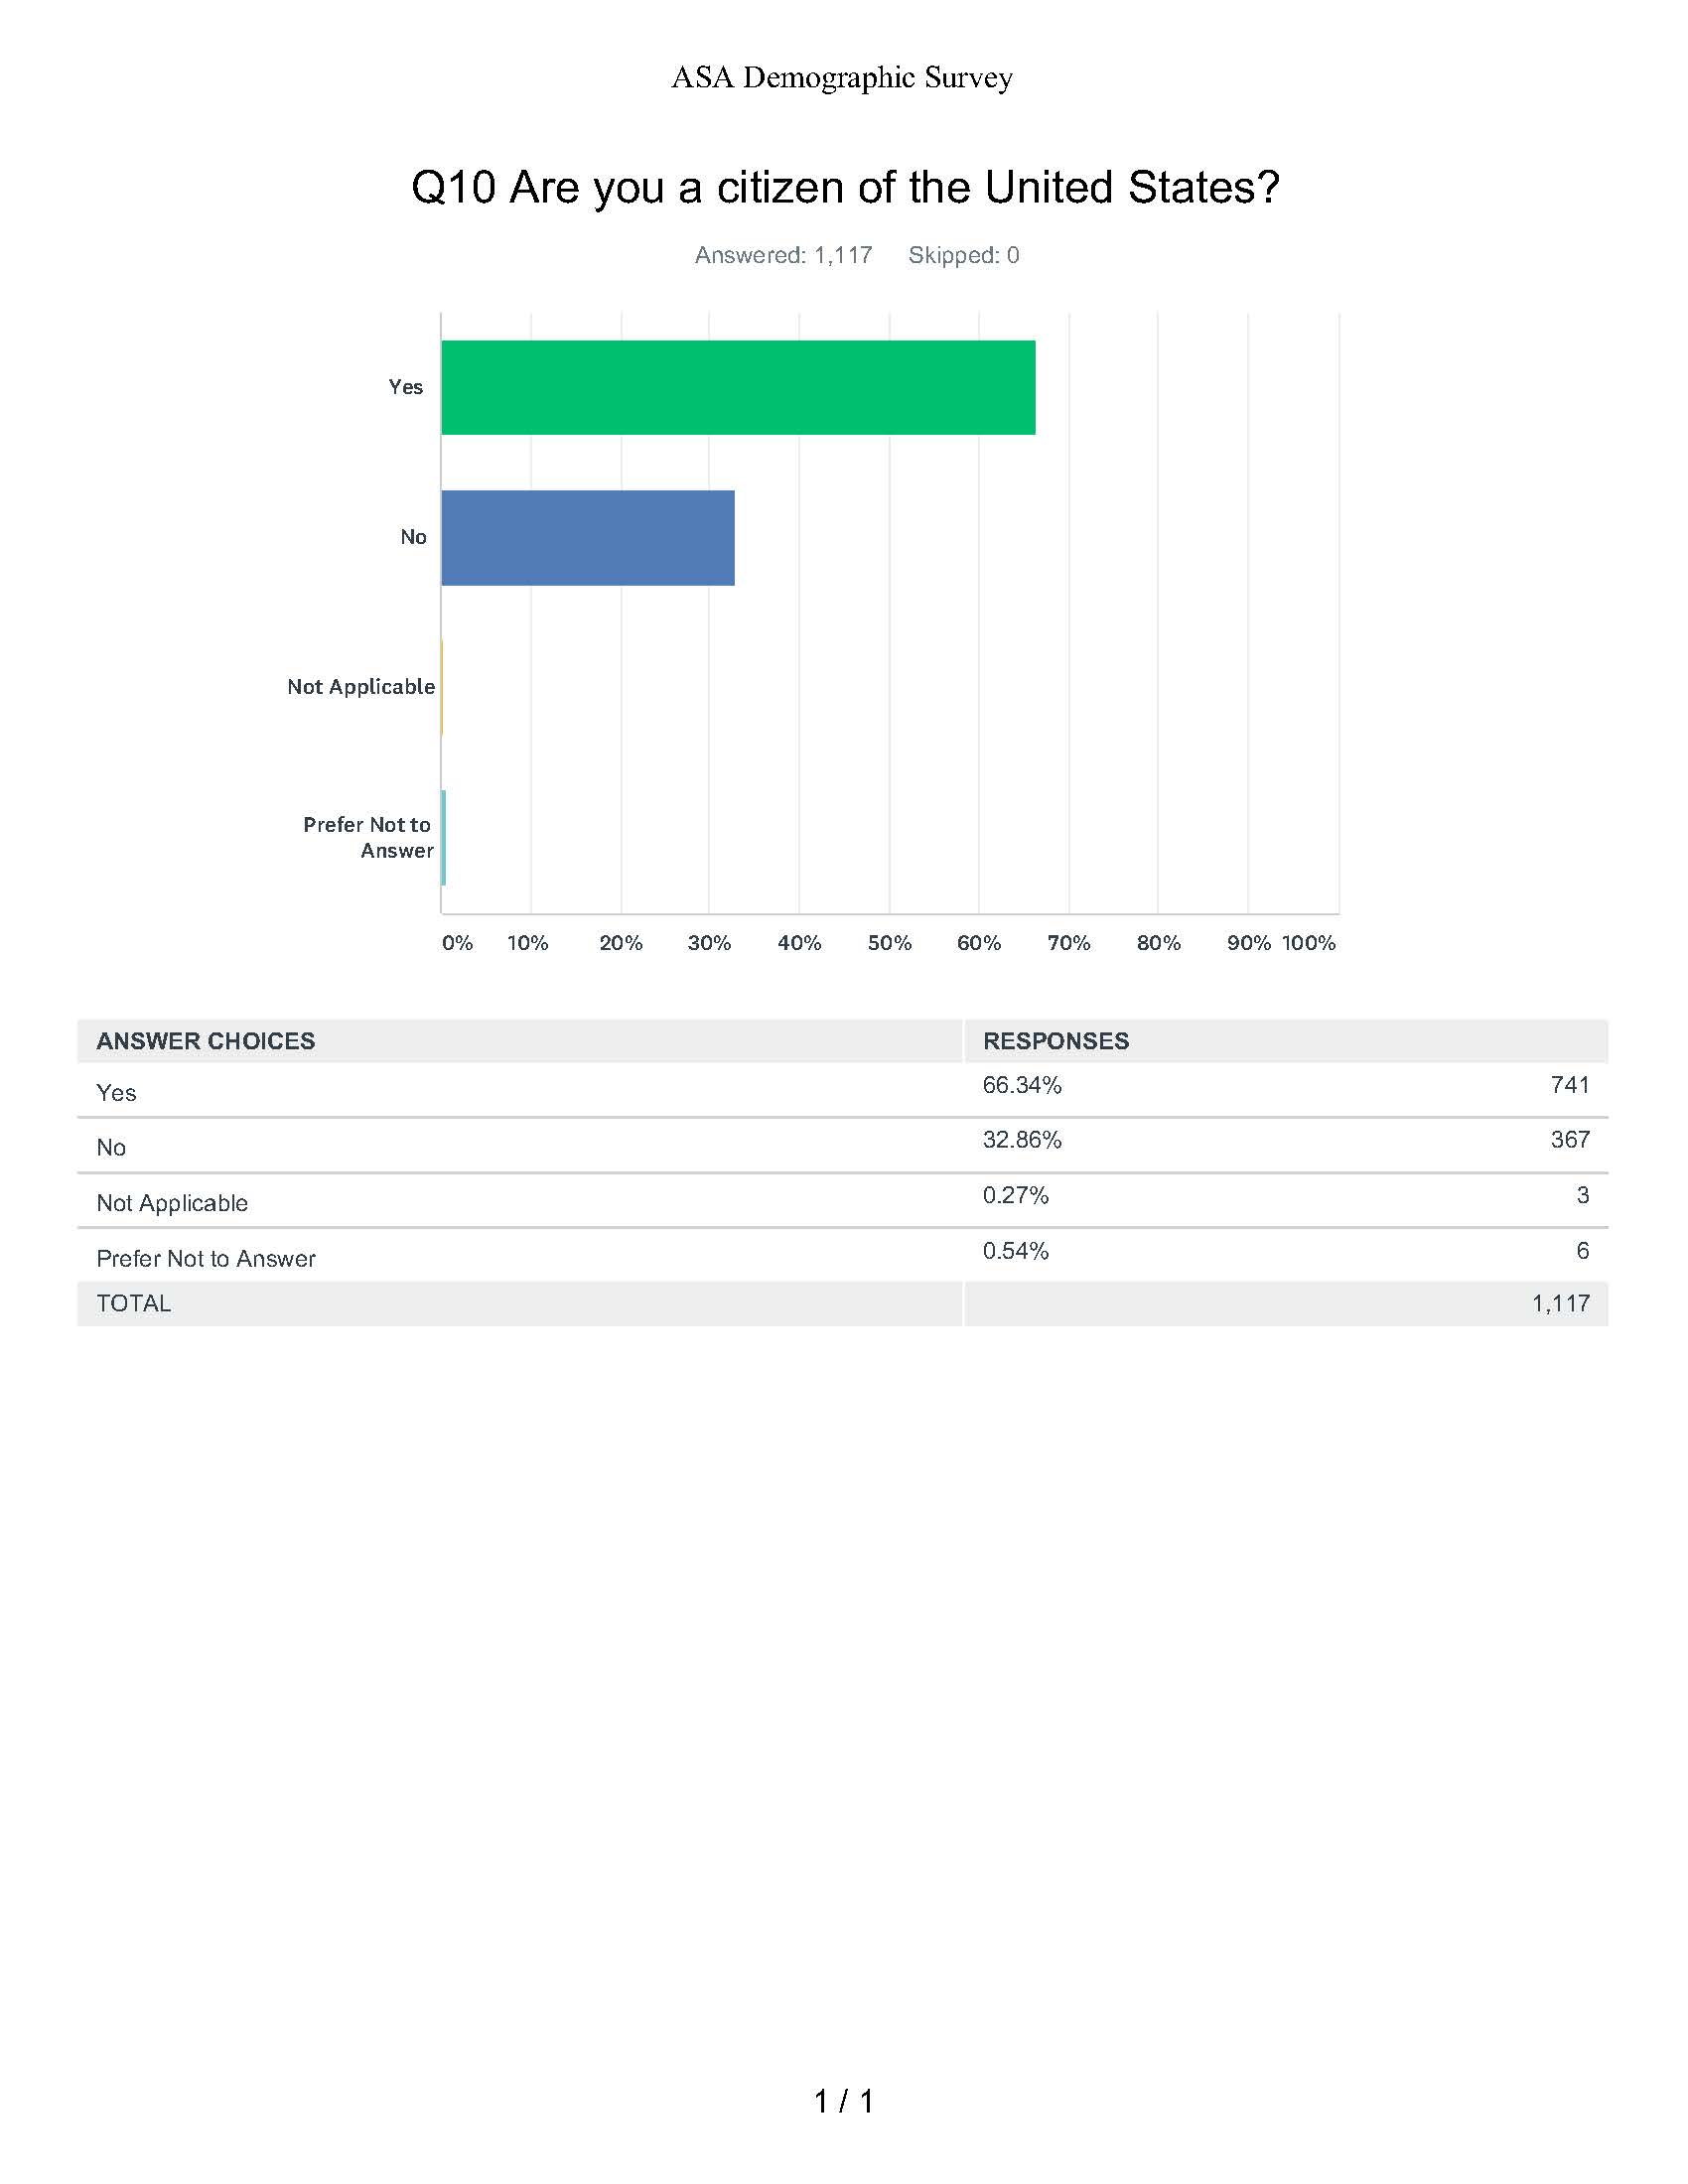
Question 10: Are You a Citizen of the United States
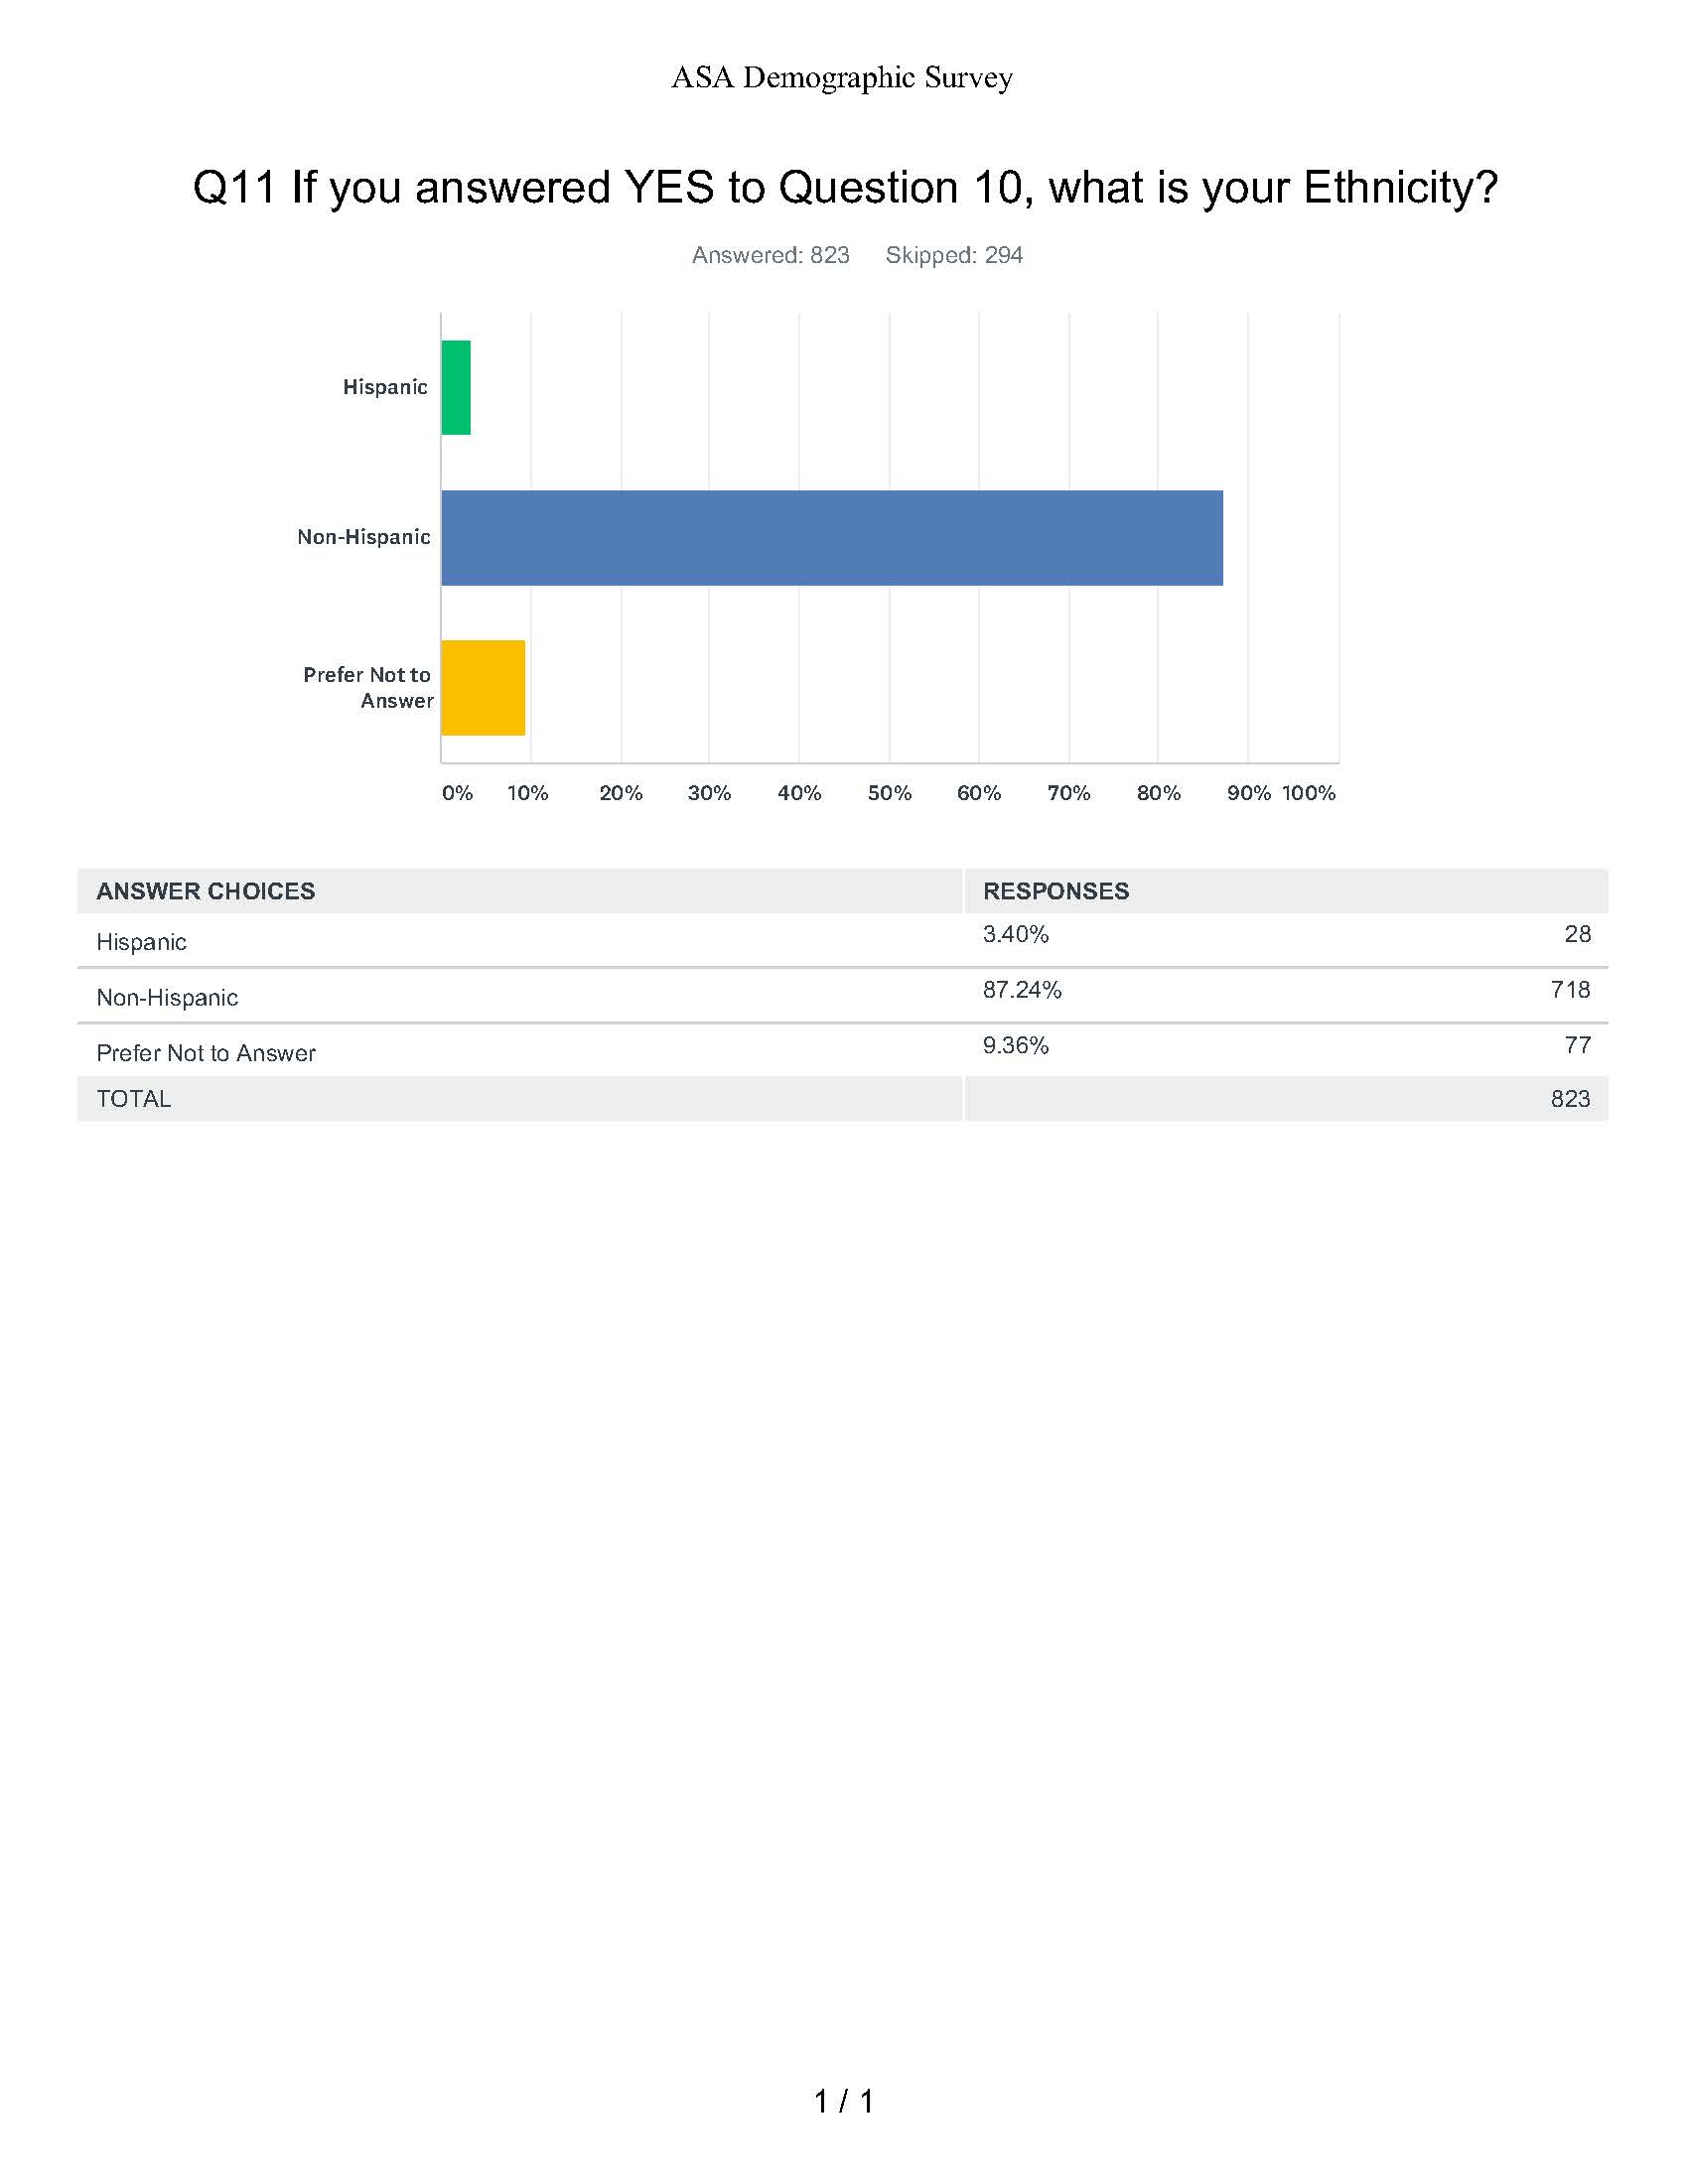
Question 11: If You Answered YES to Question 10, What is Your Ethnicity
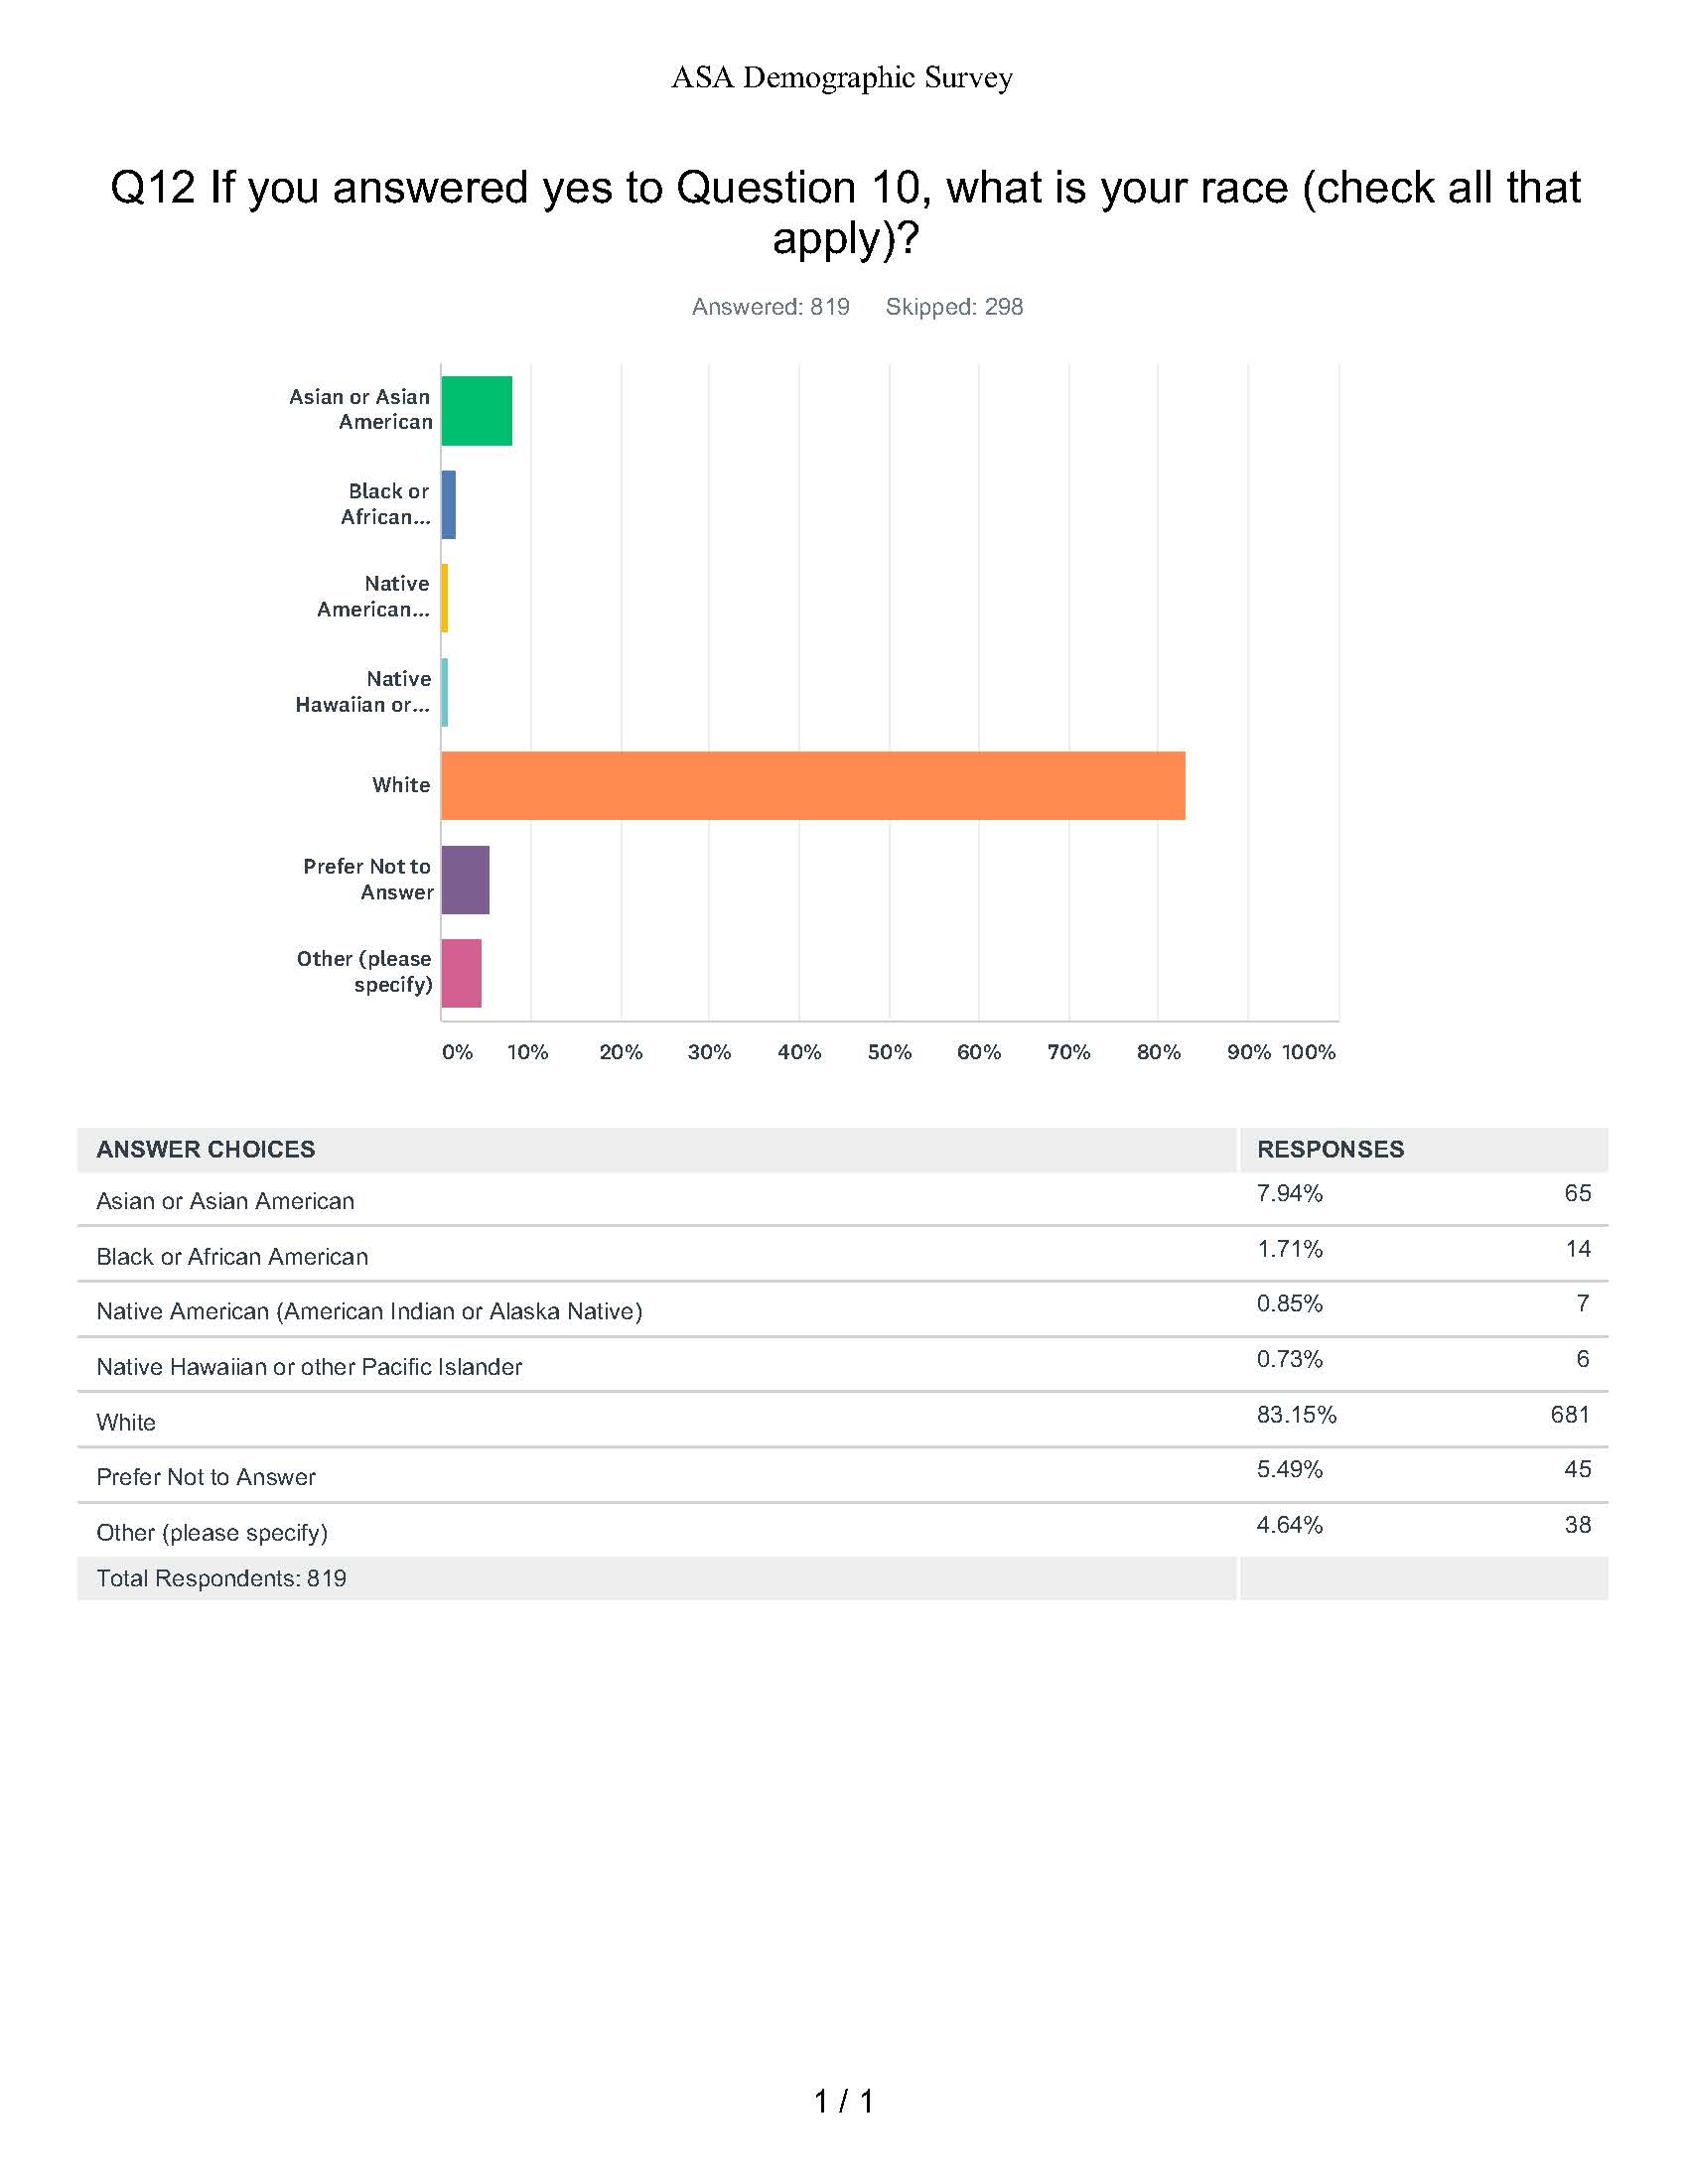
Question 12: If You Answered Yes to Question 10, What is Your Race (check all that apply)
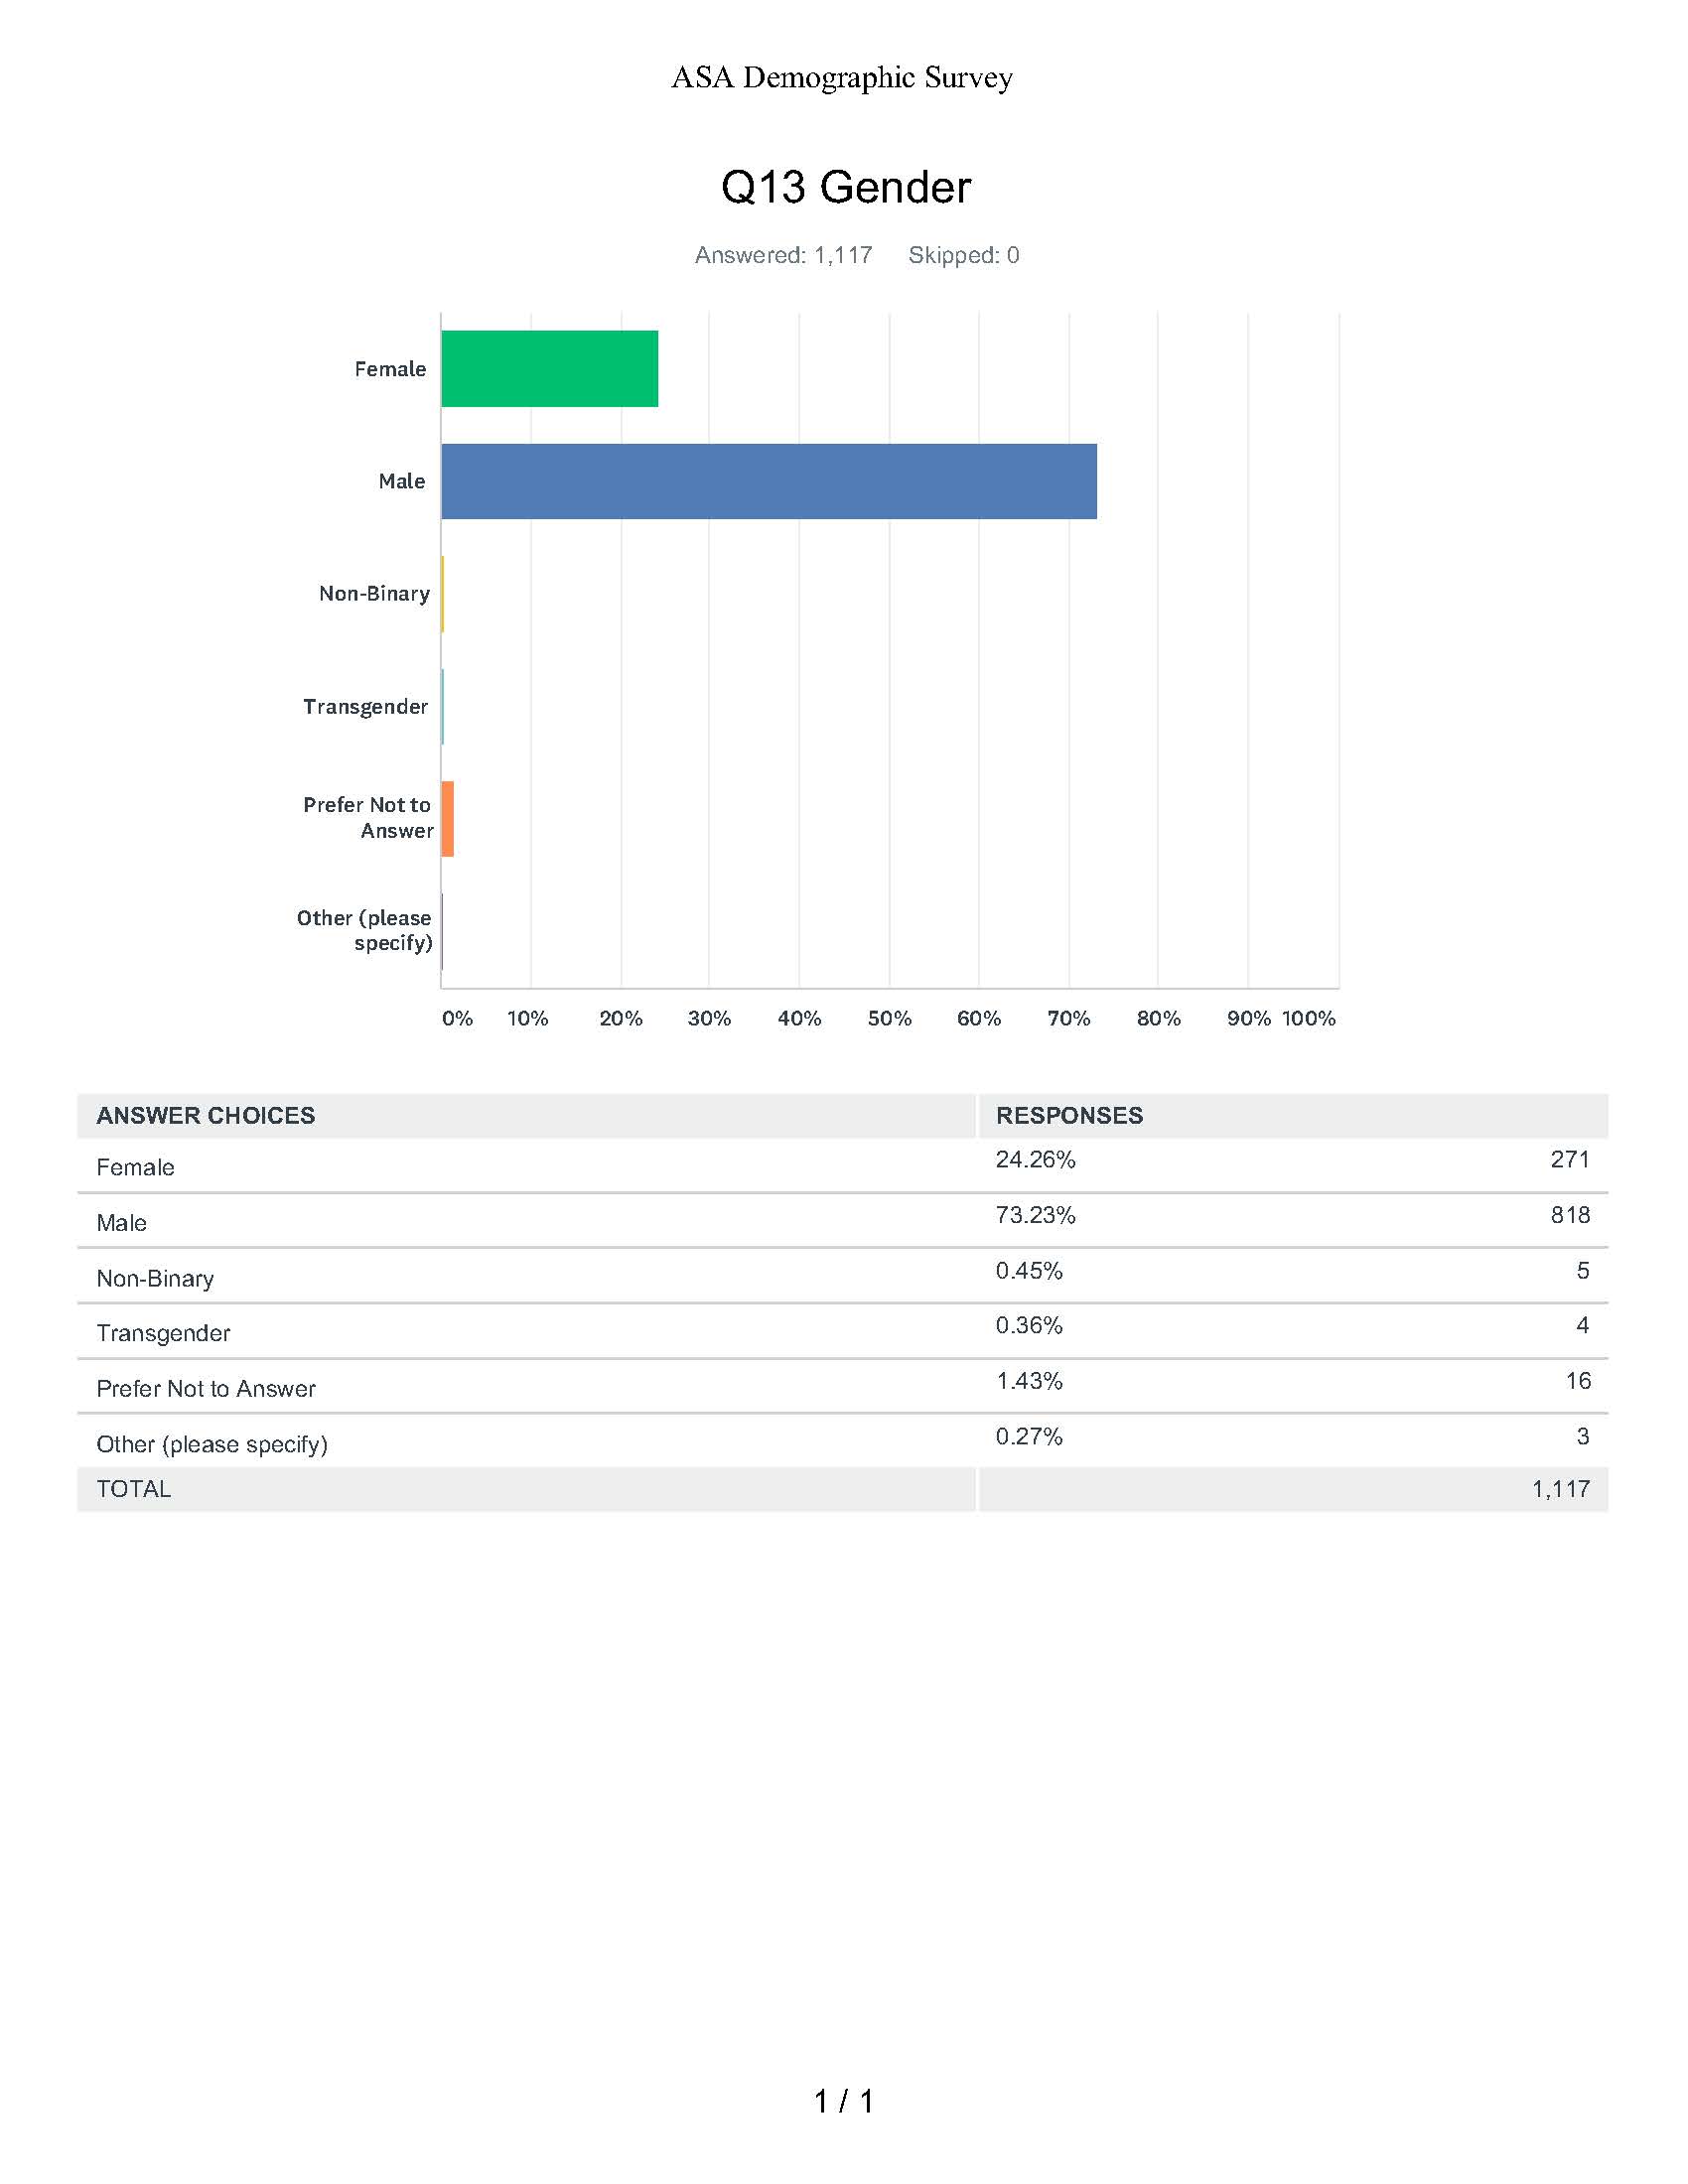
Question 13: Gender
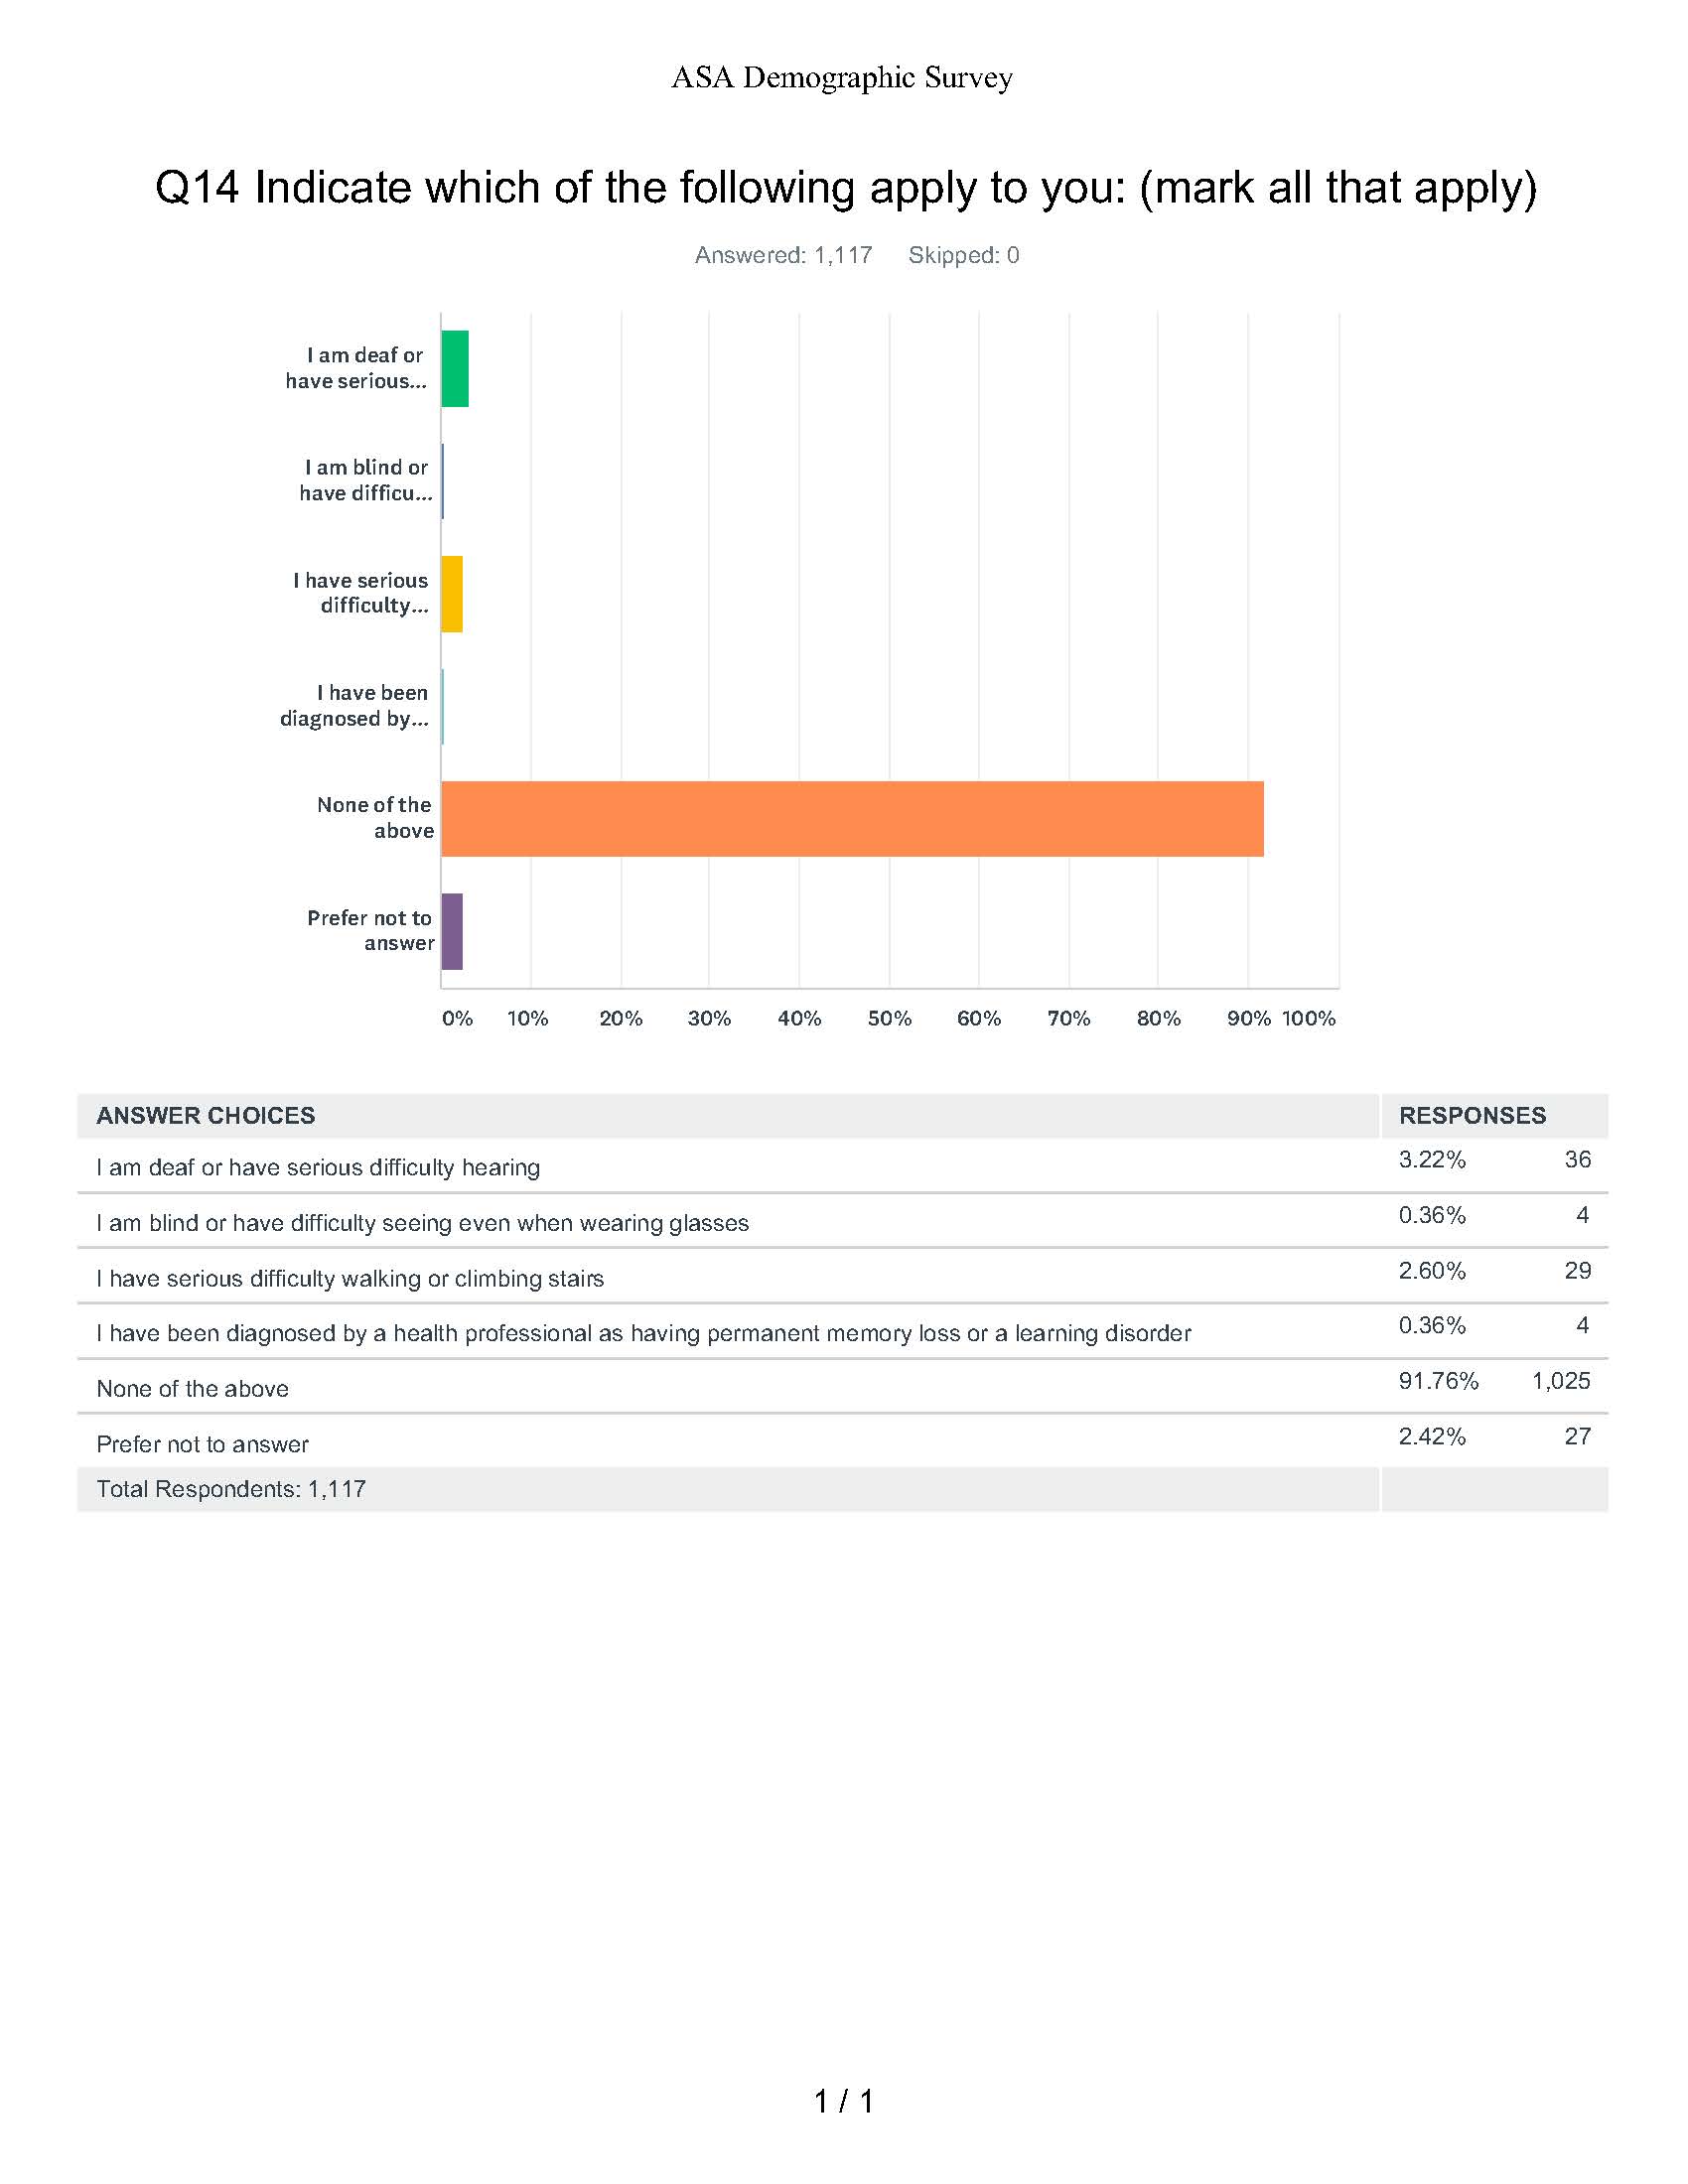
Question 14: Indicate Which of the Following Apply to You (check all that apply)
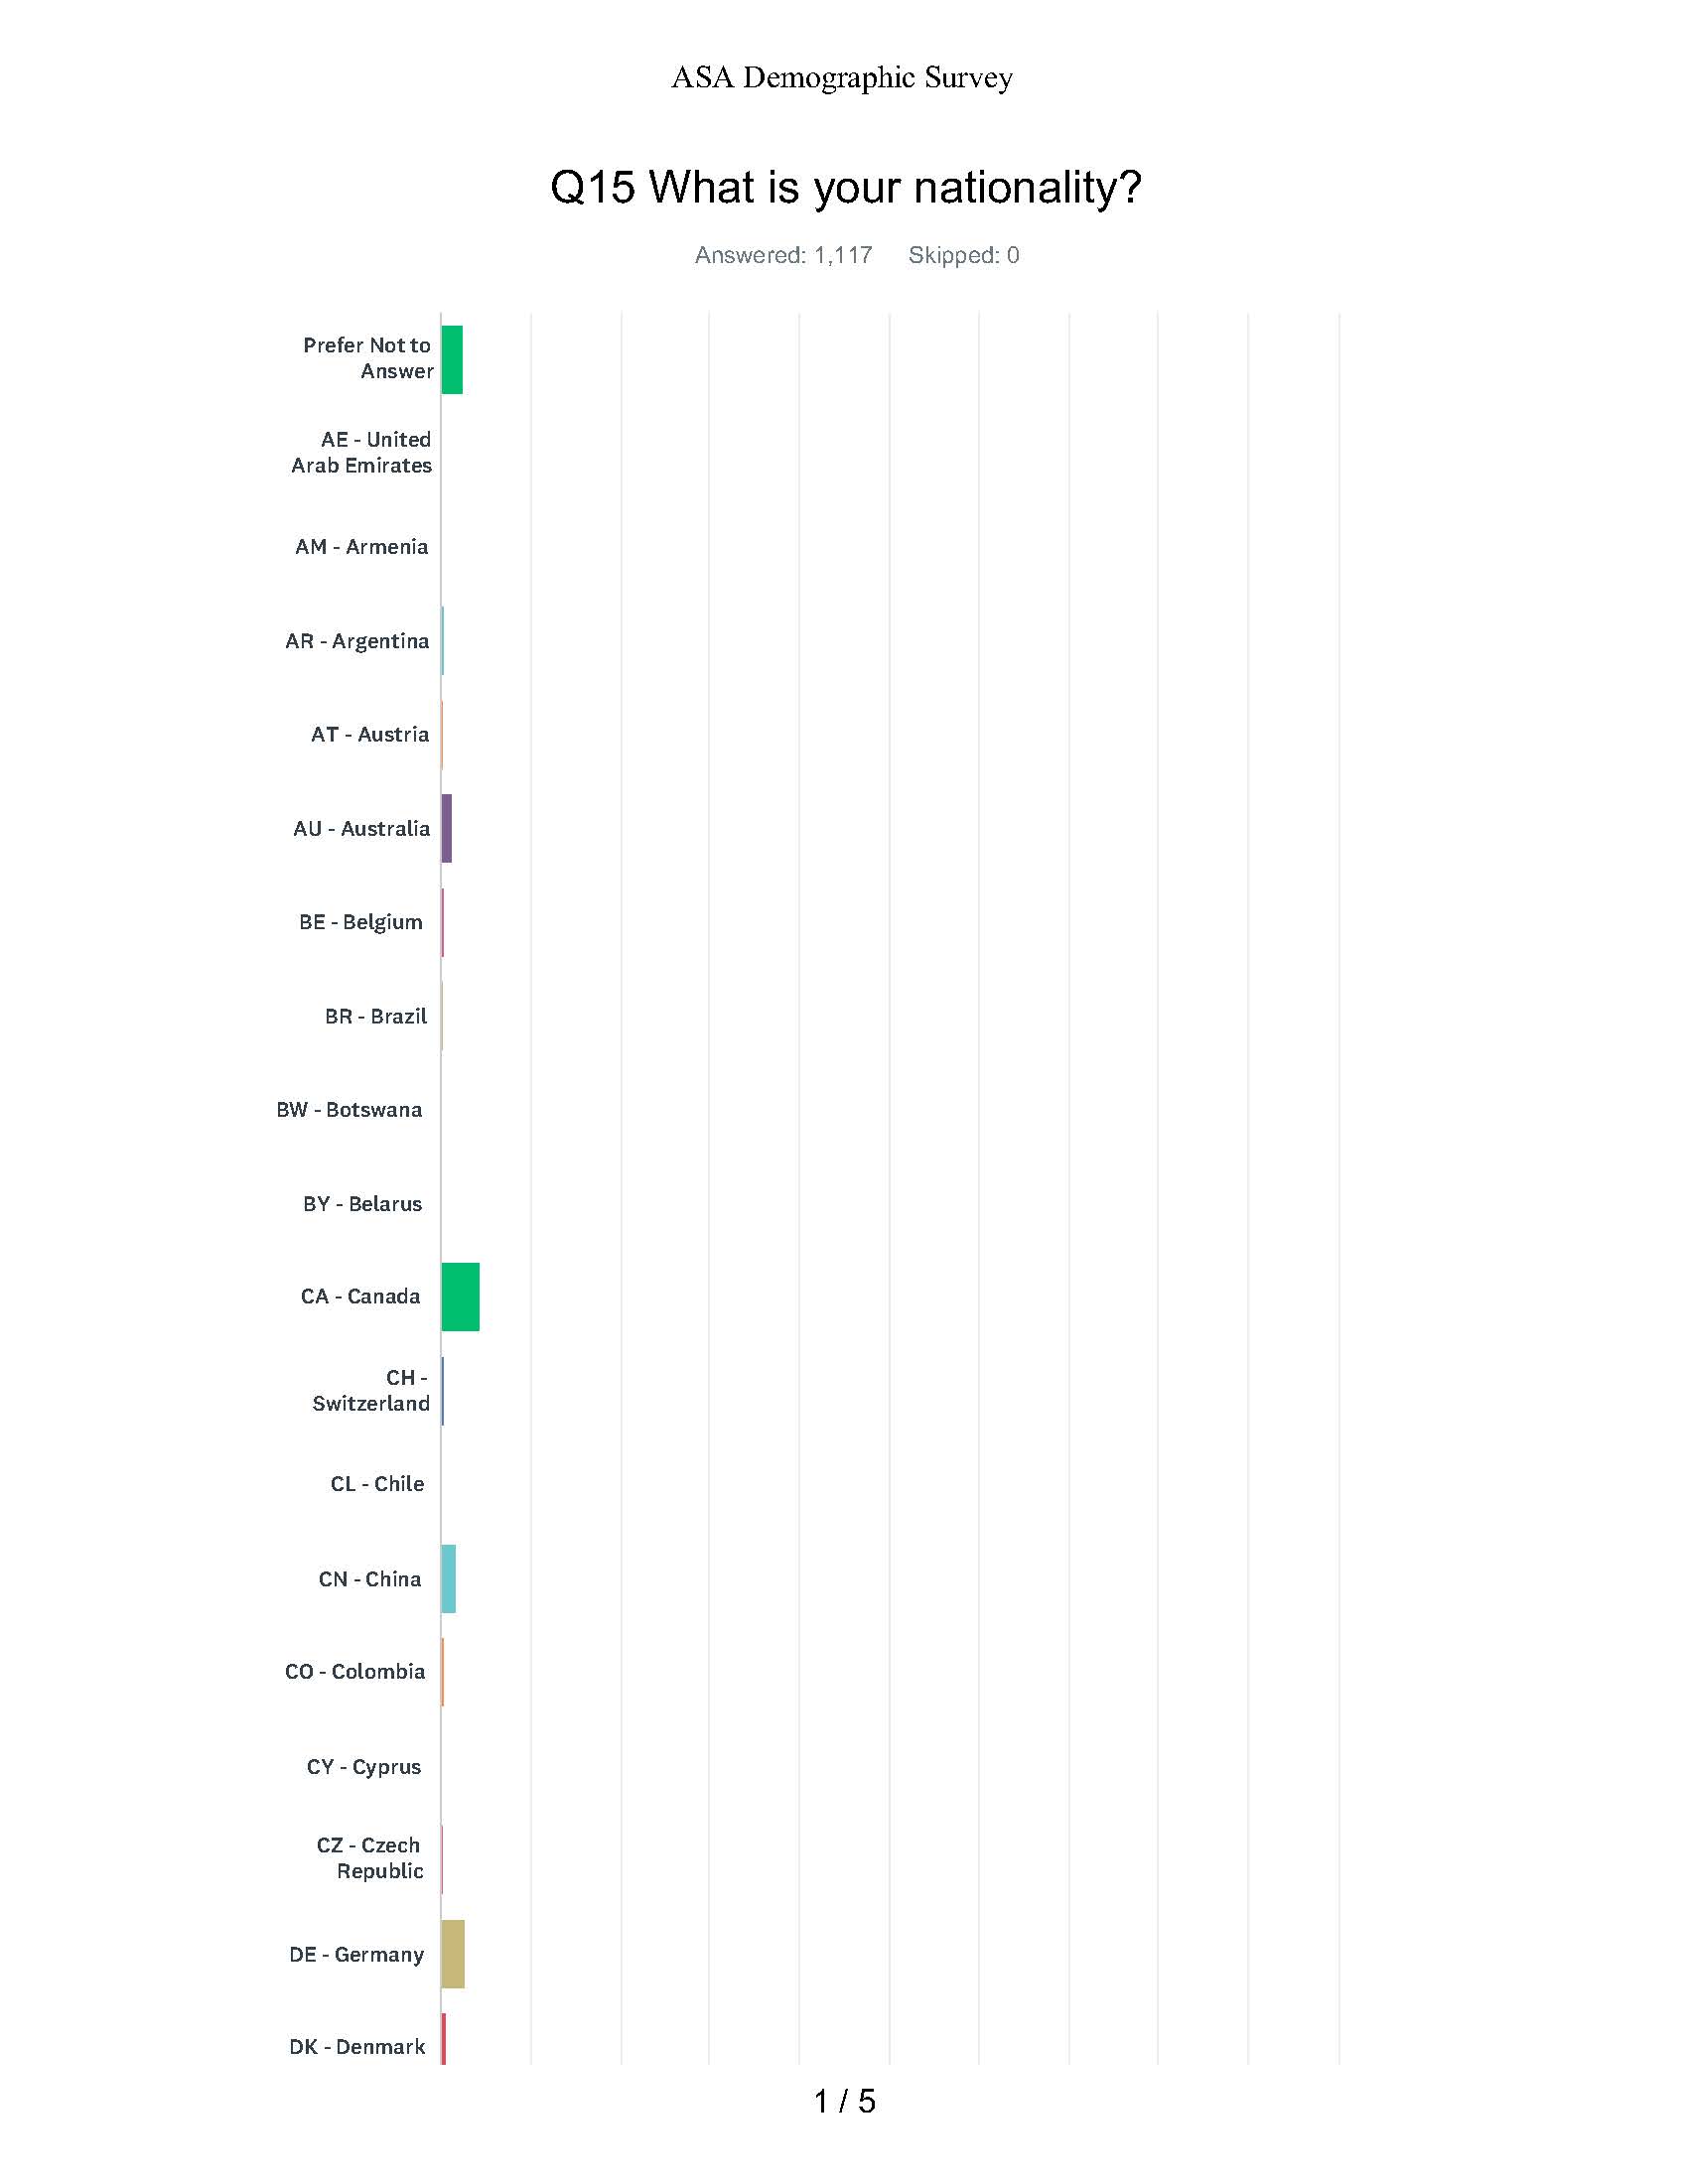
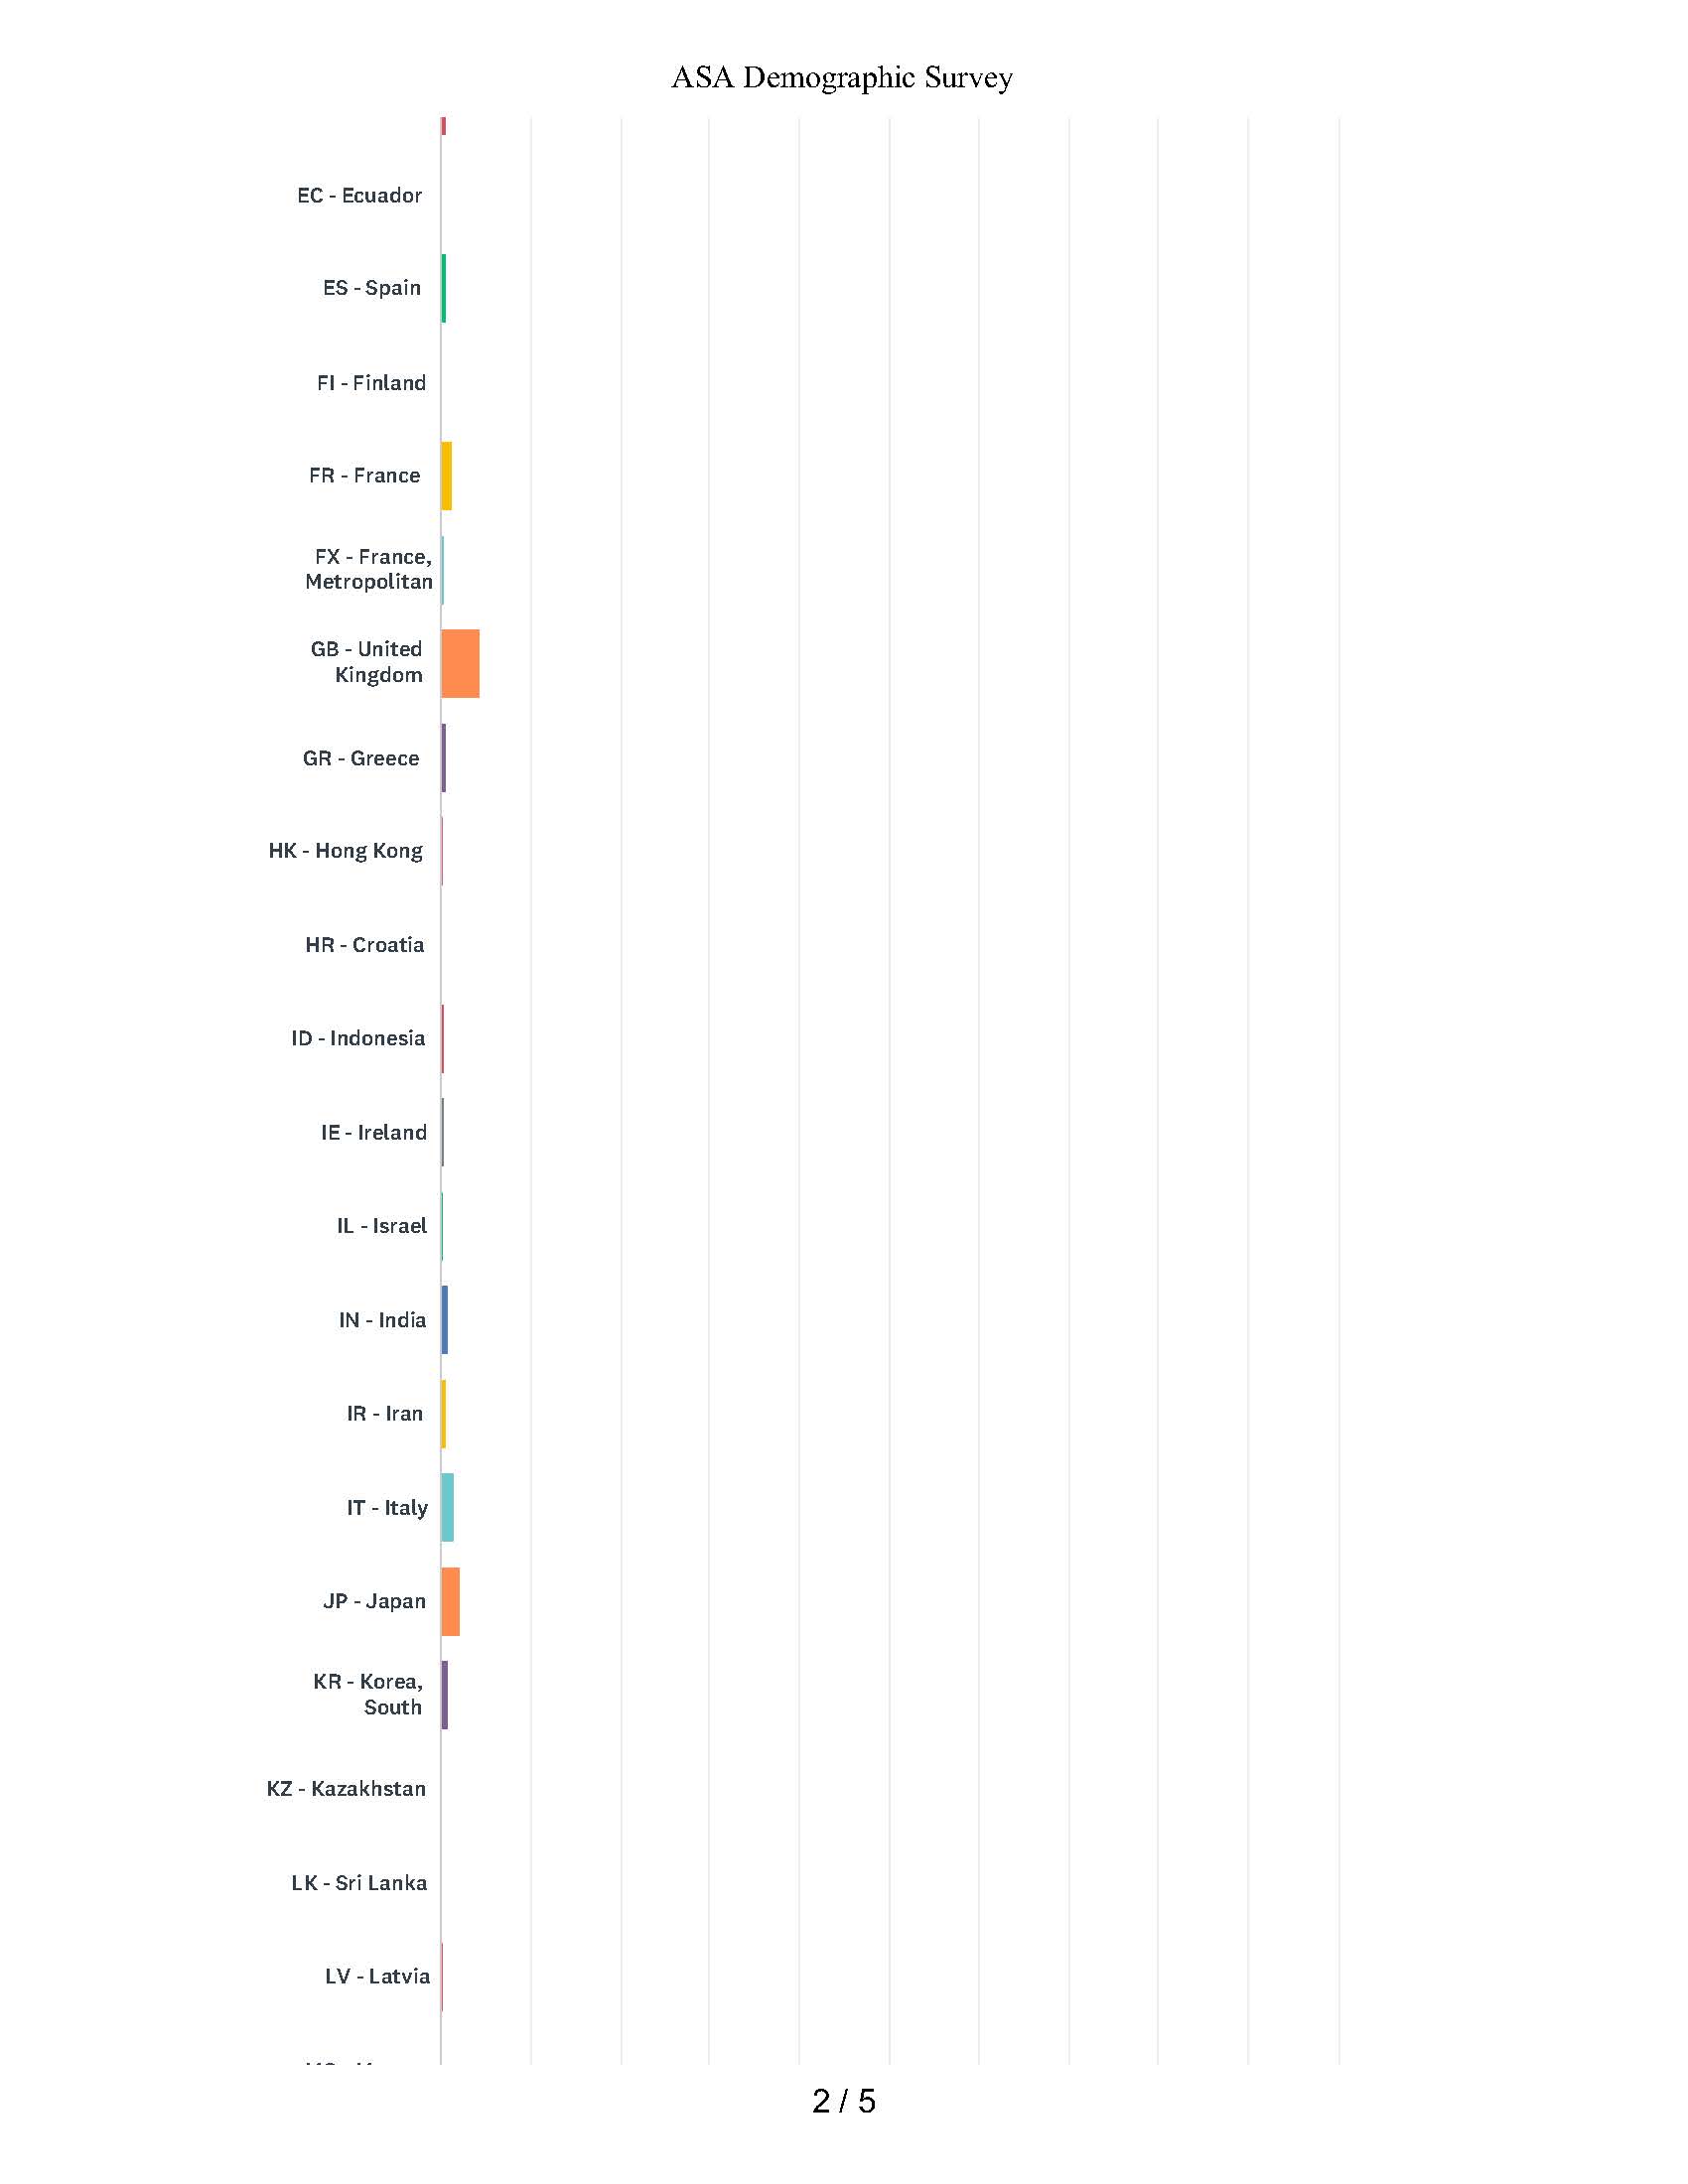
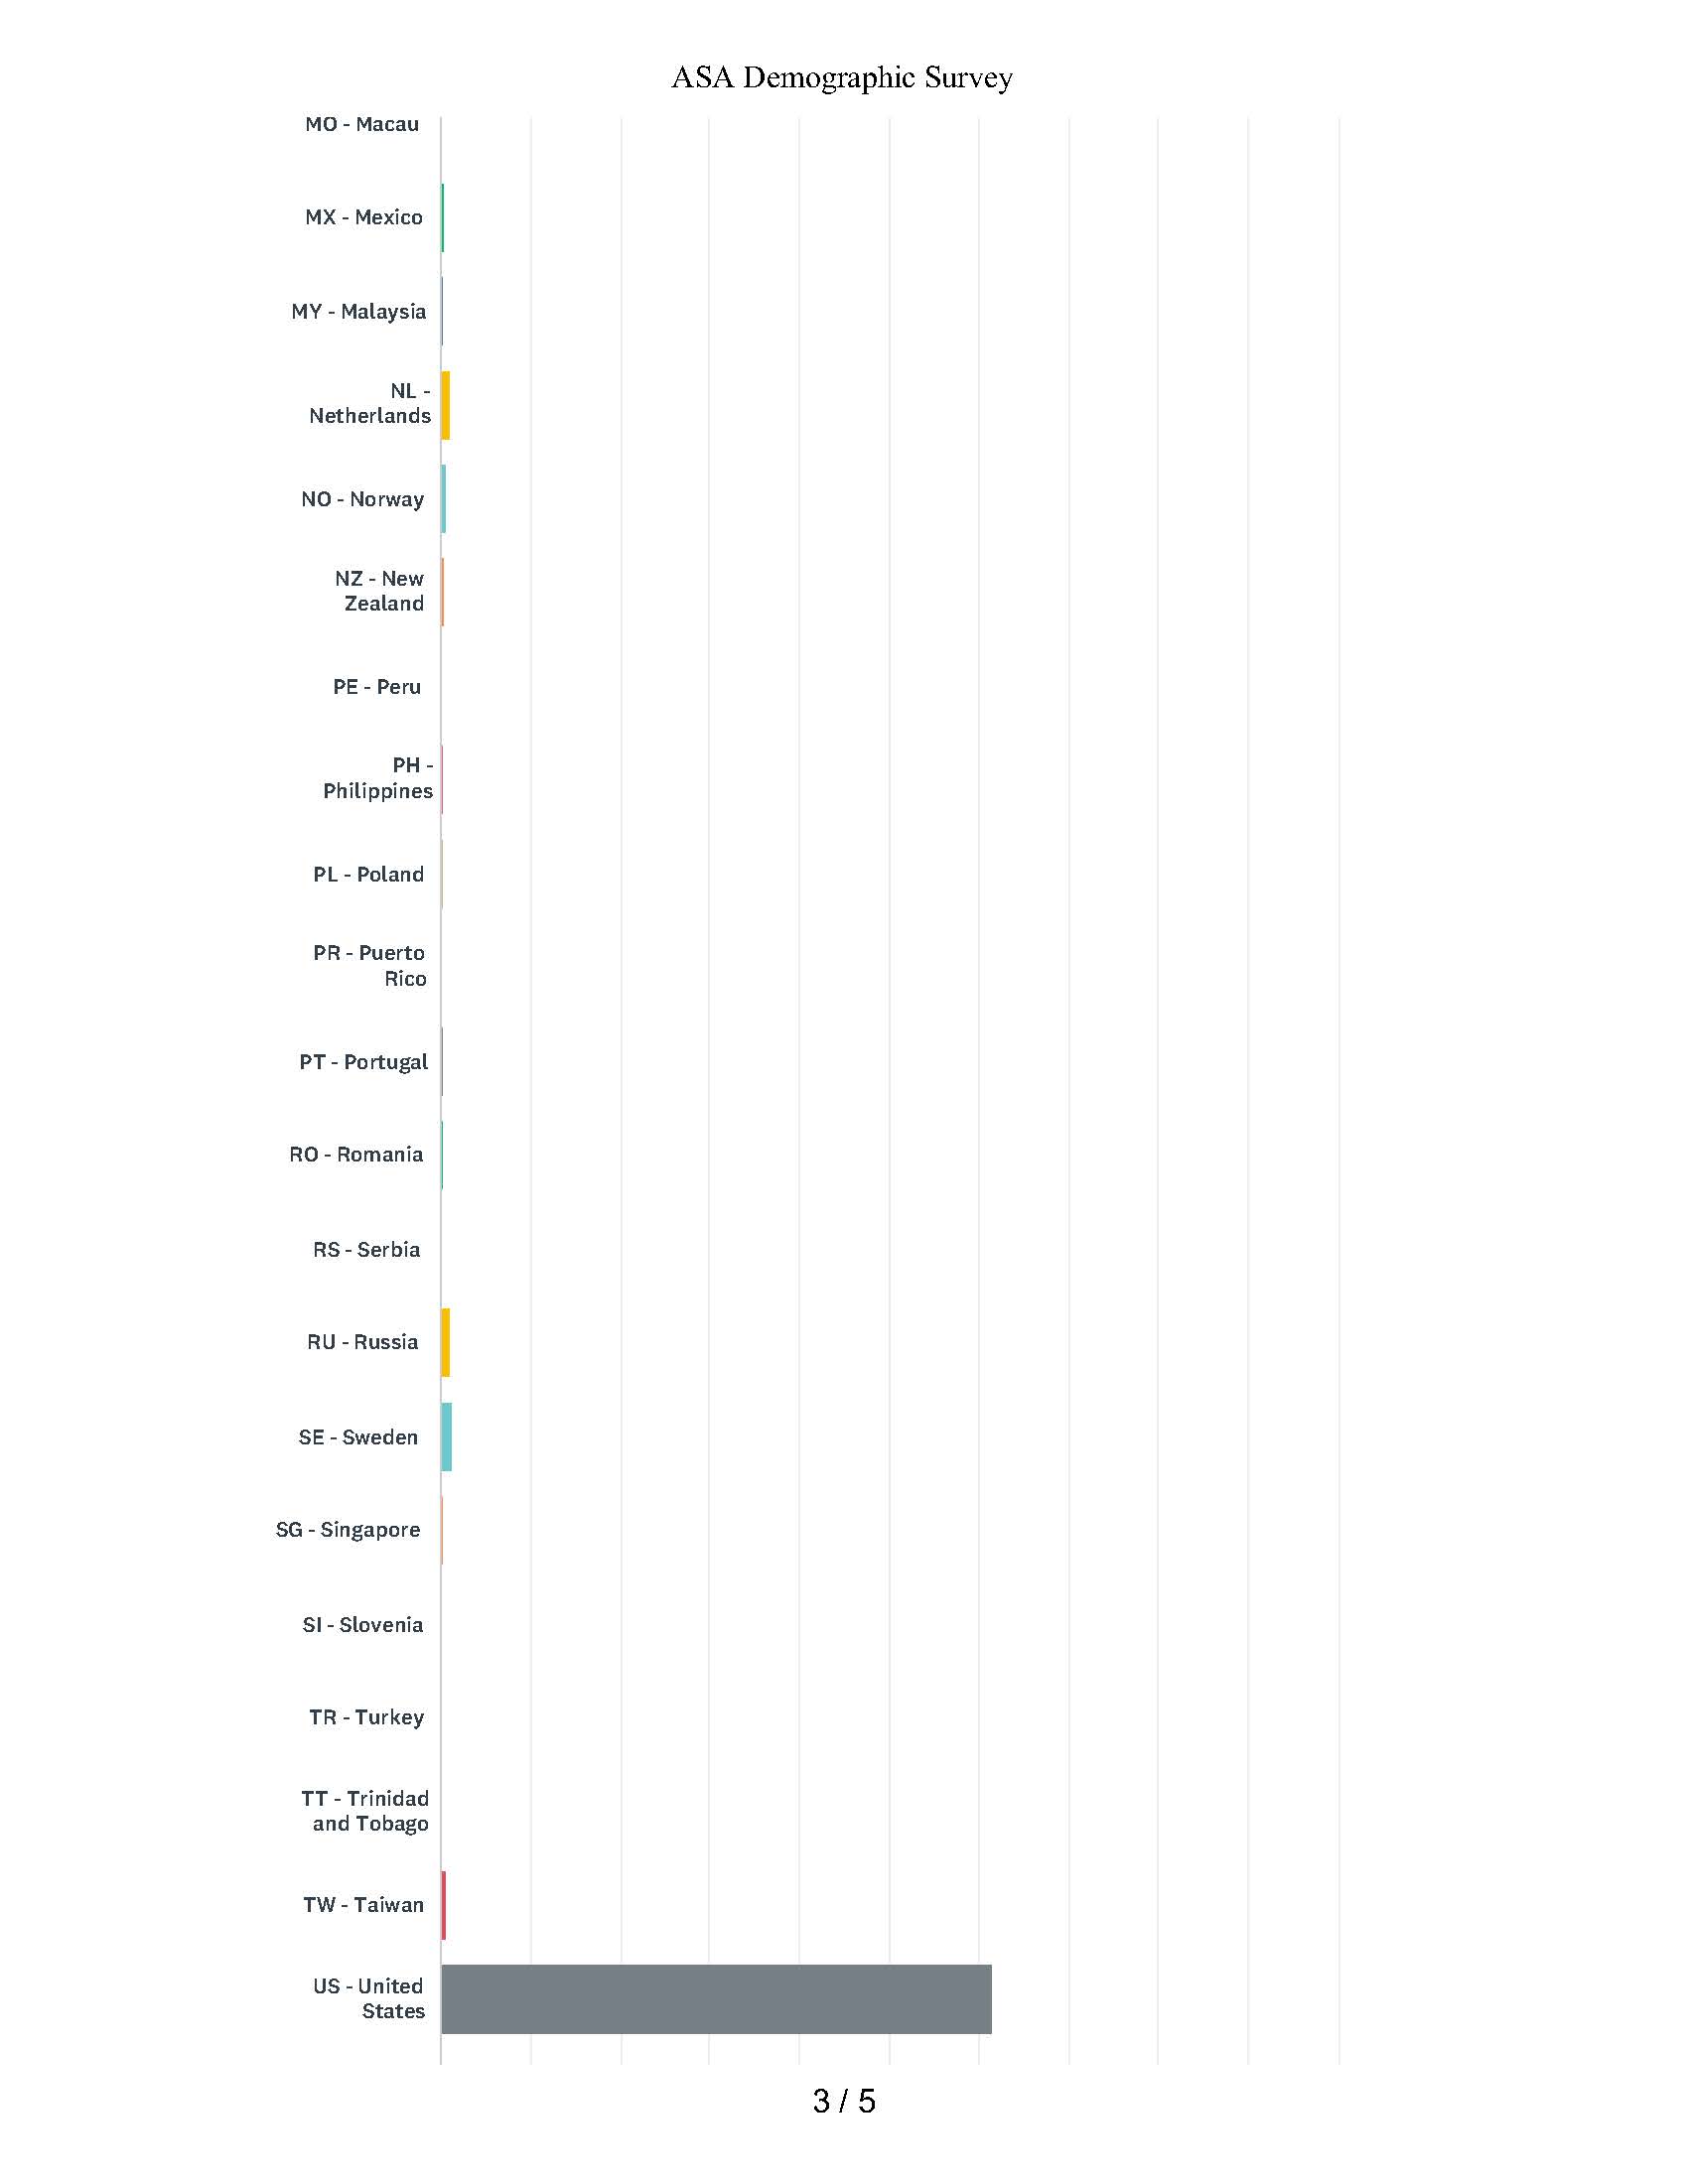
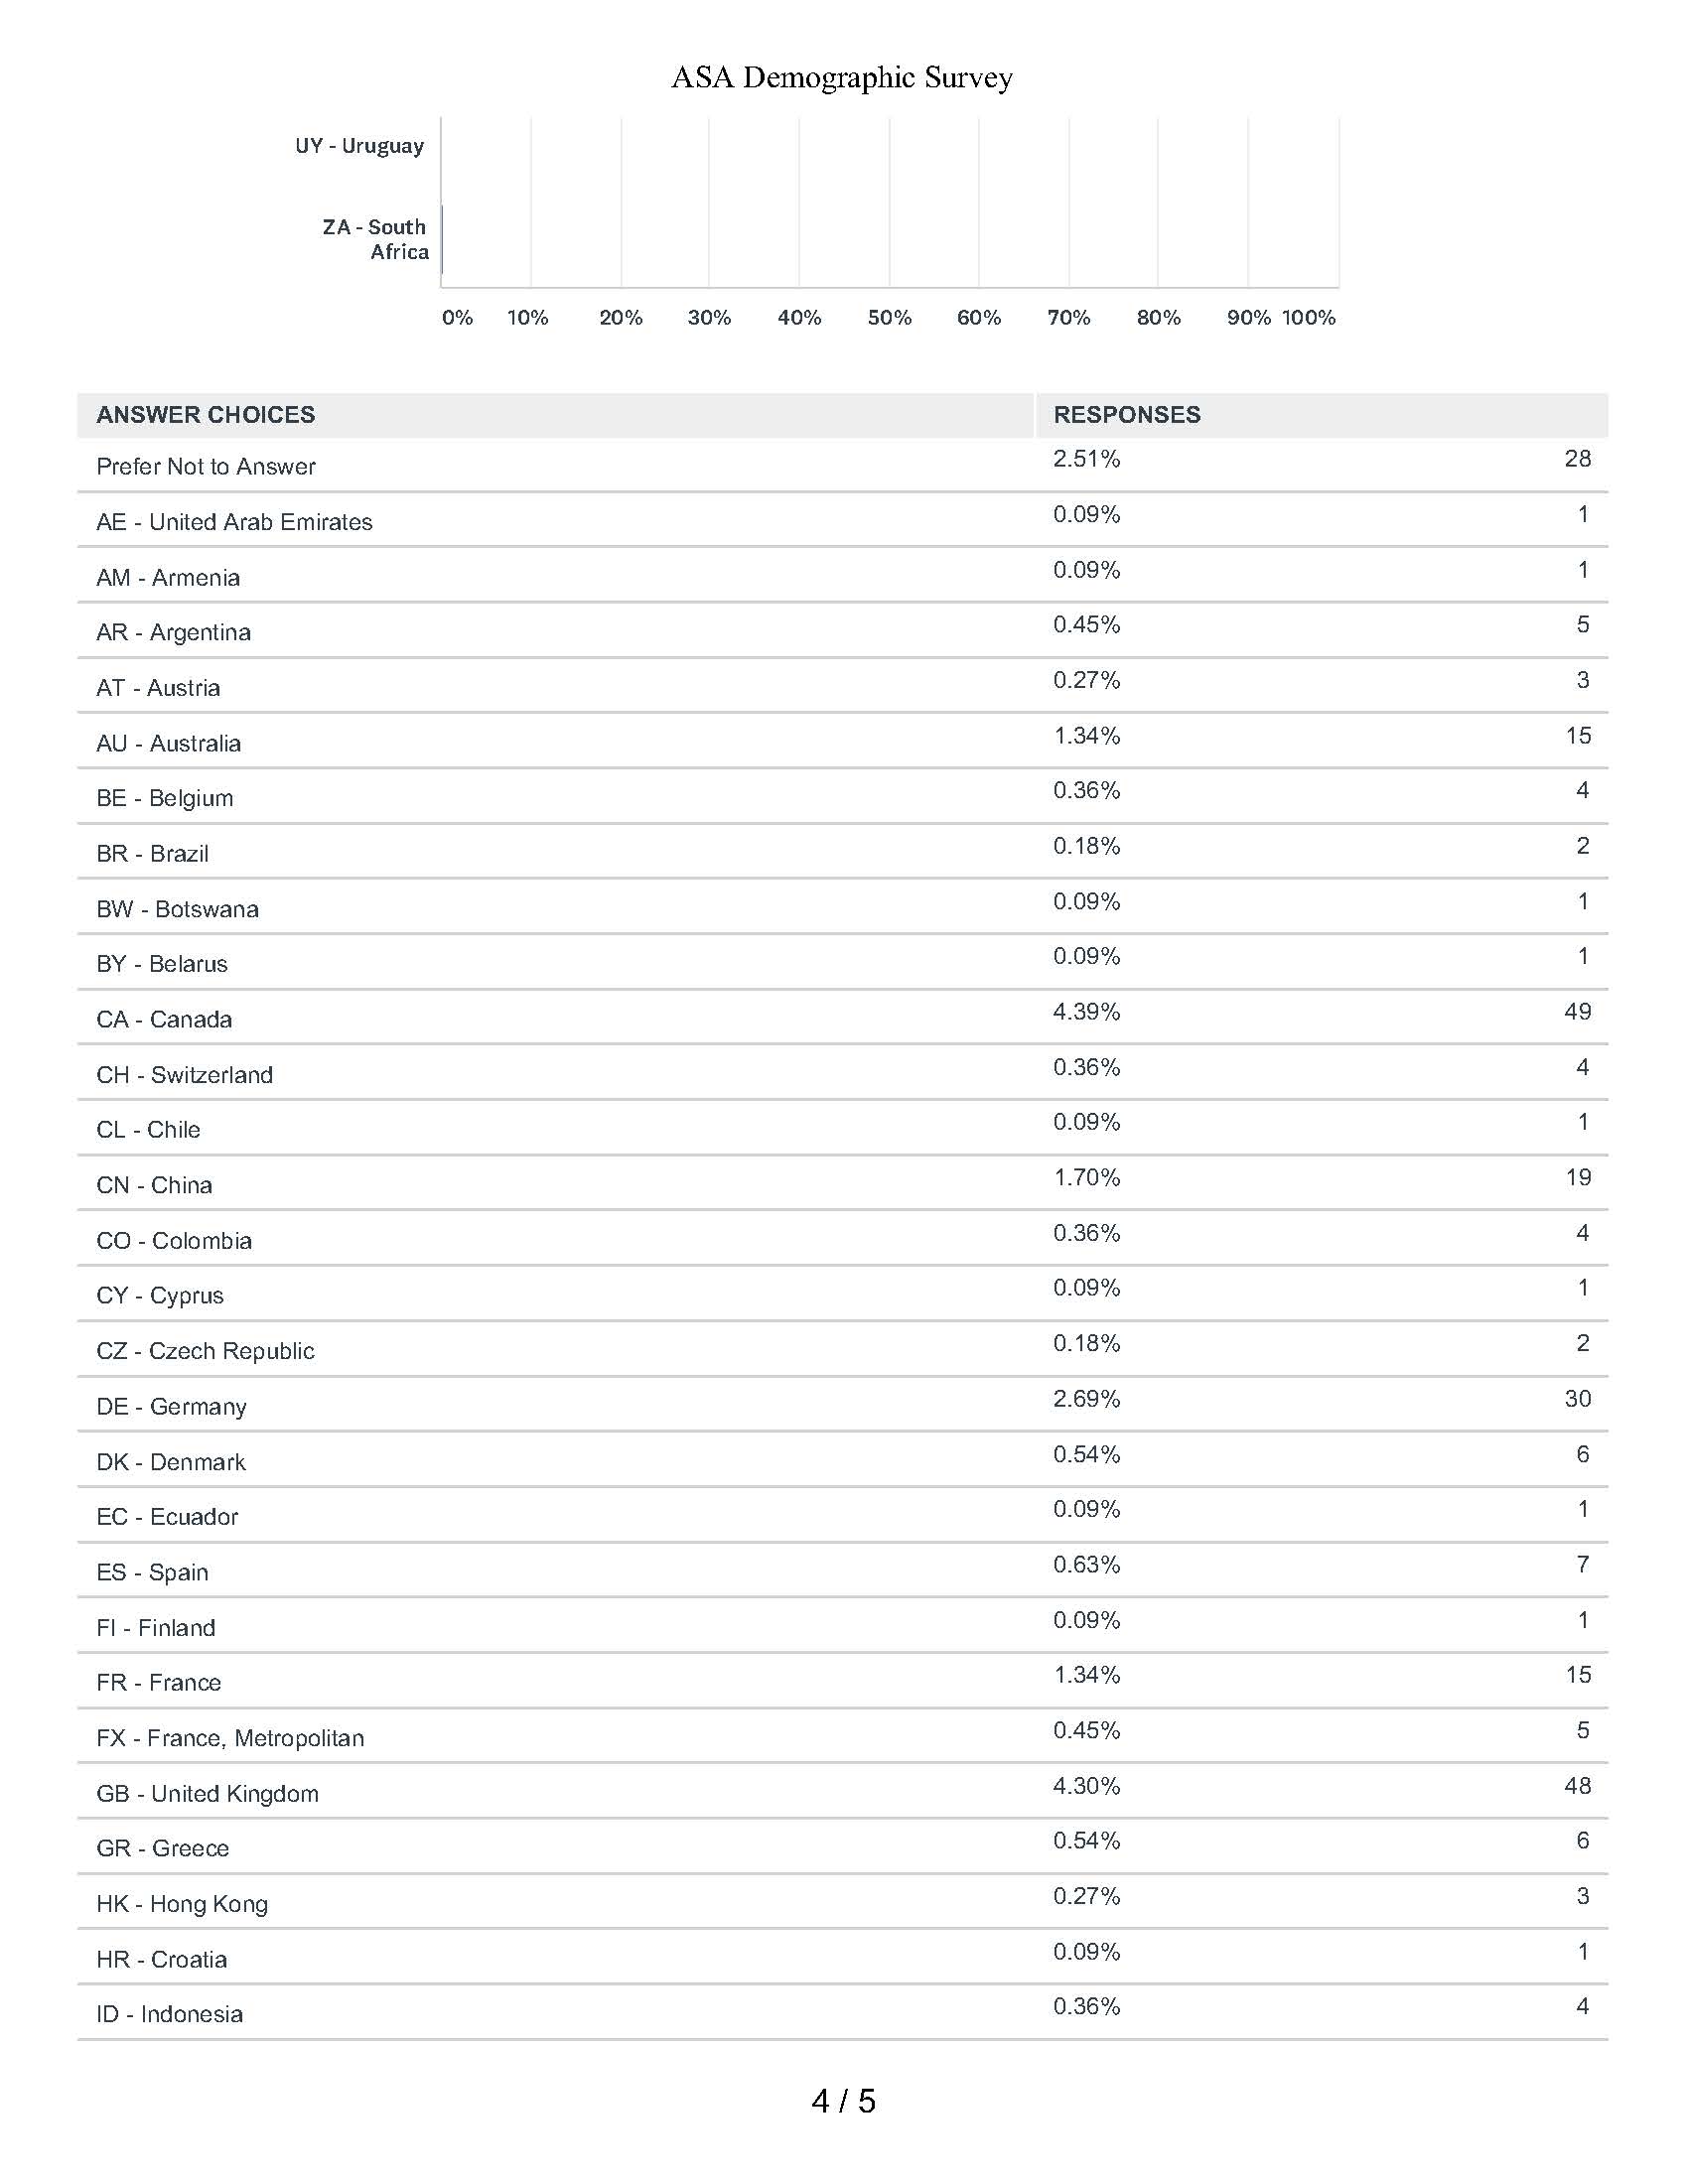
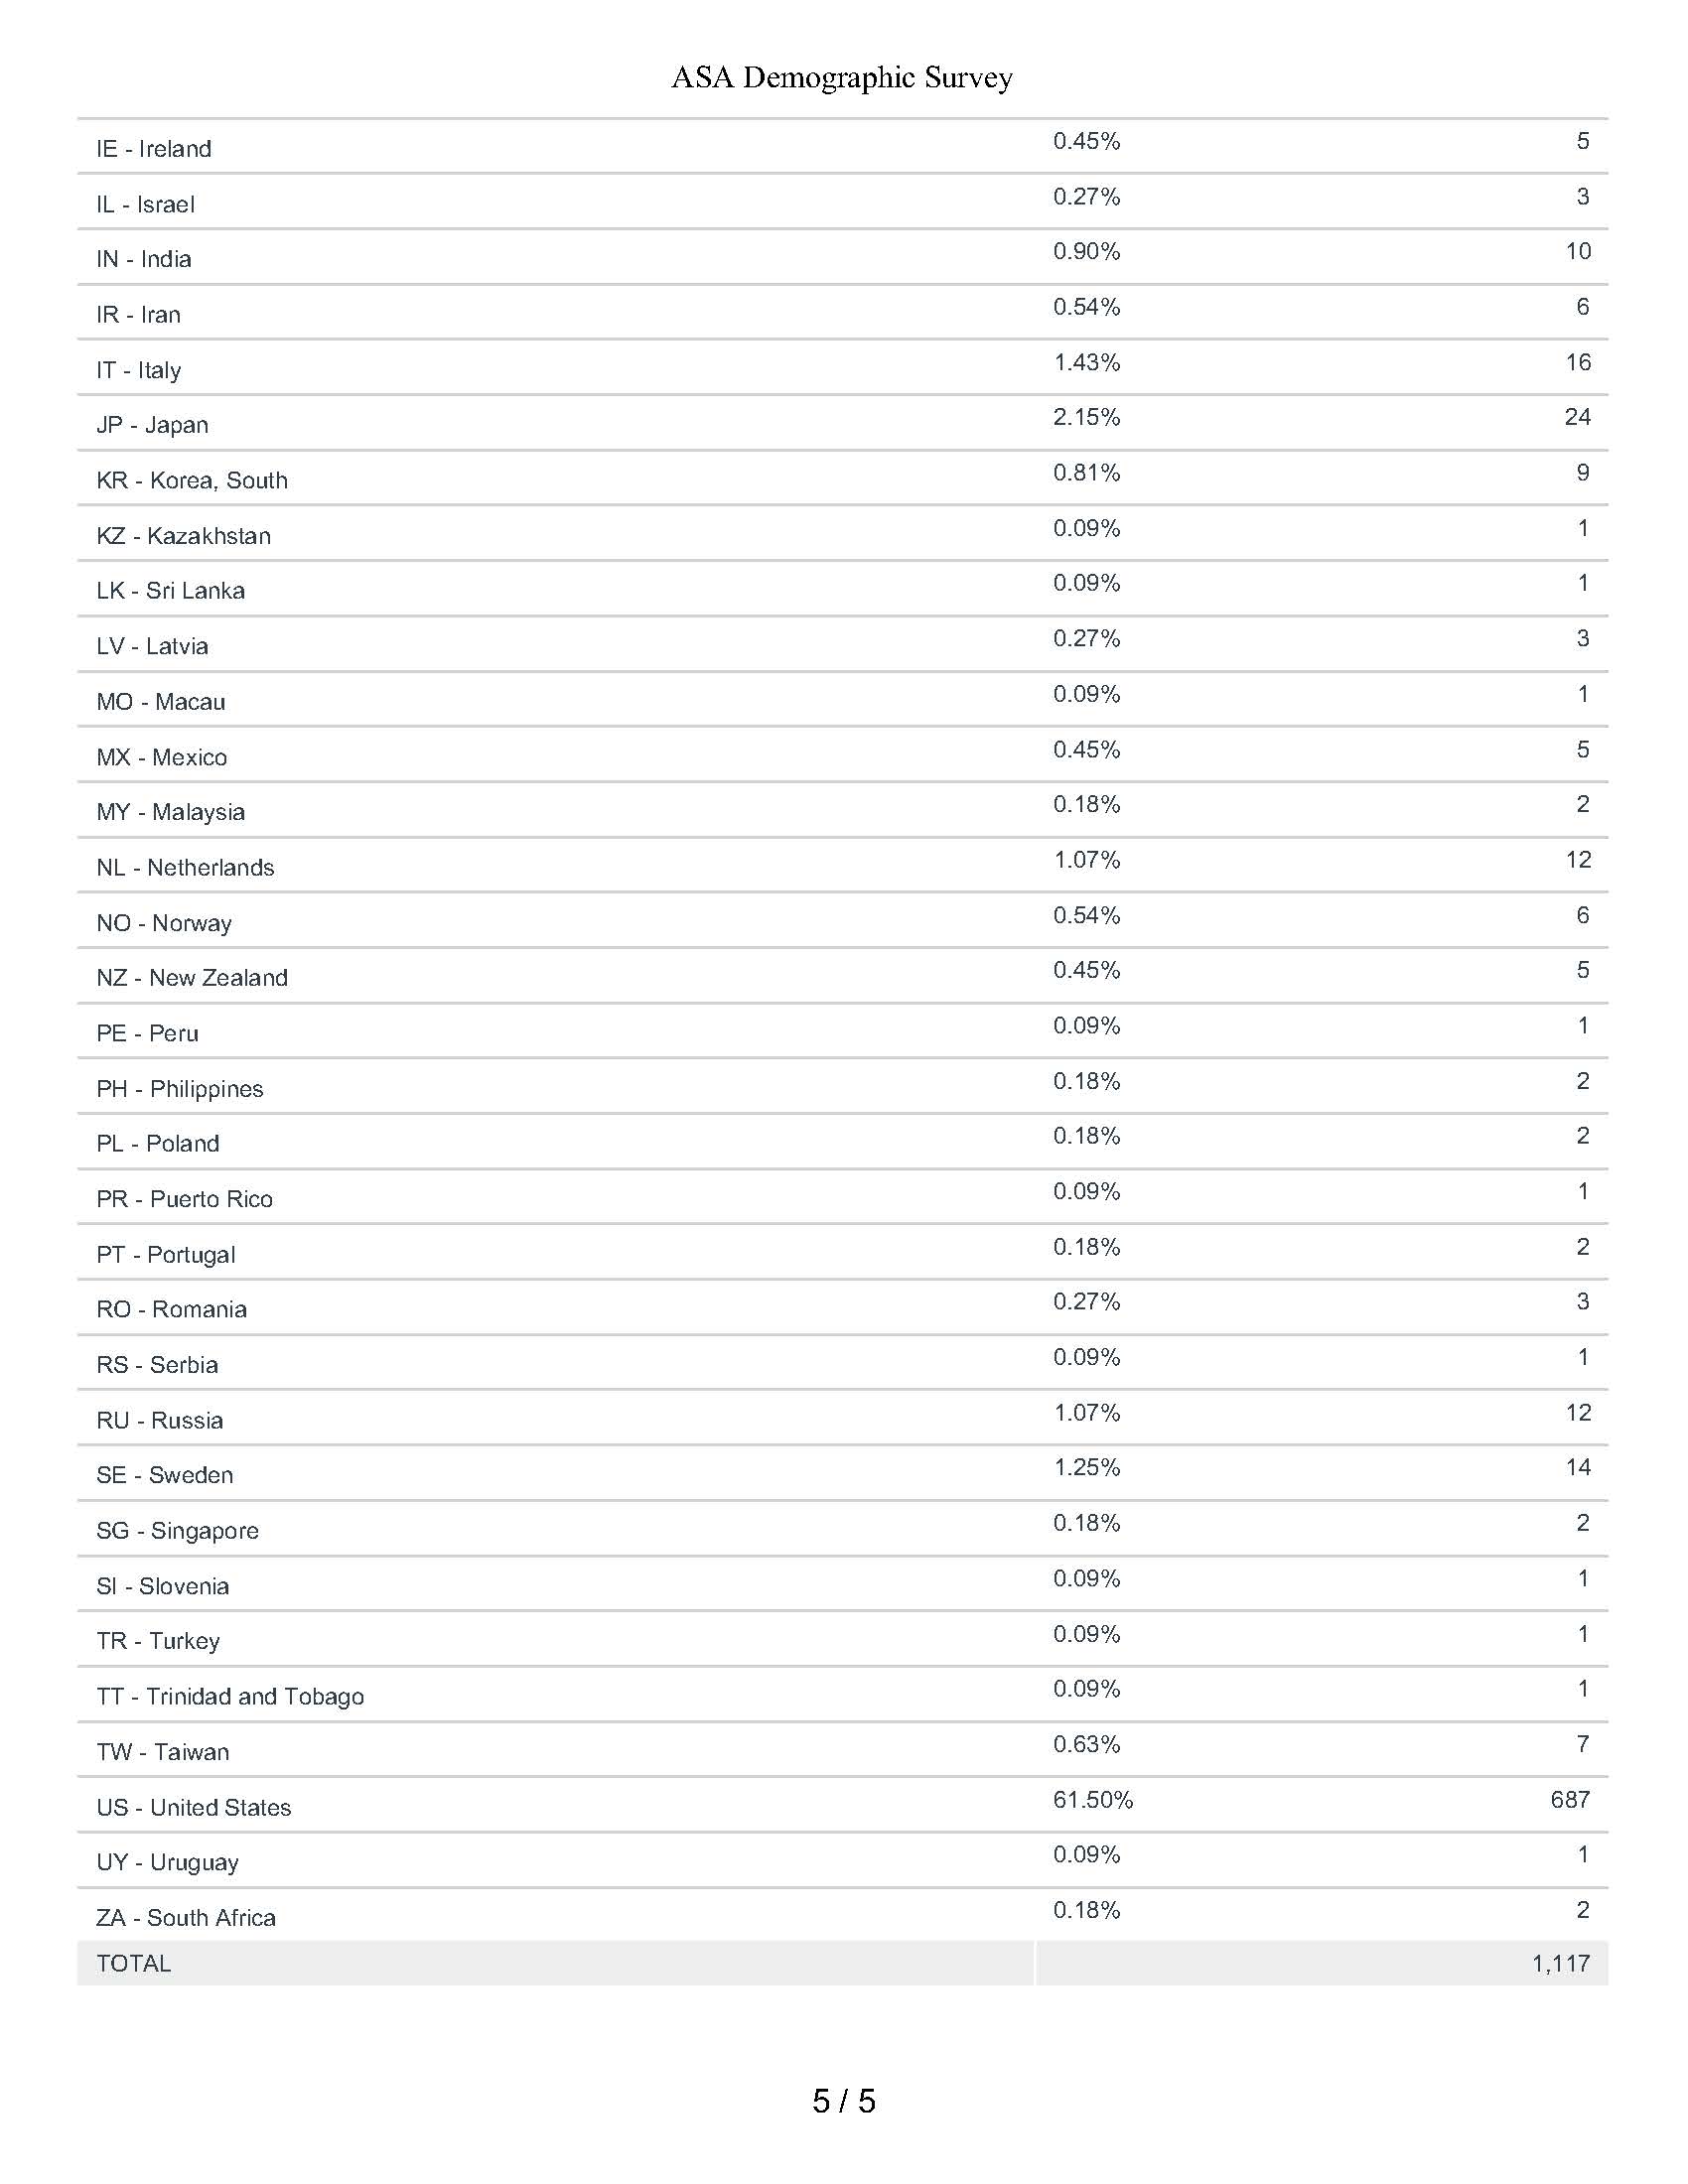
Question 15: What is Your Nationality
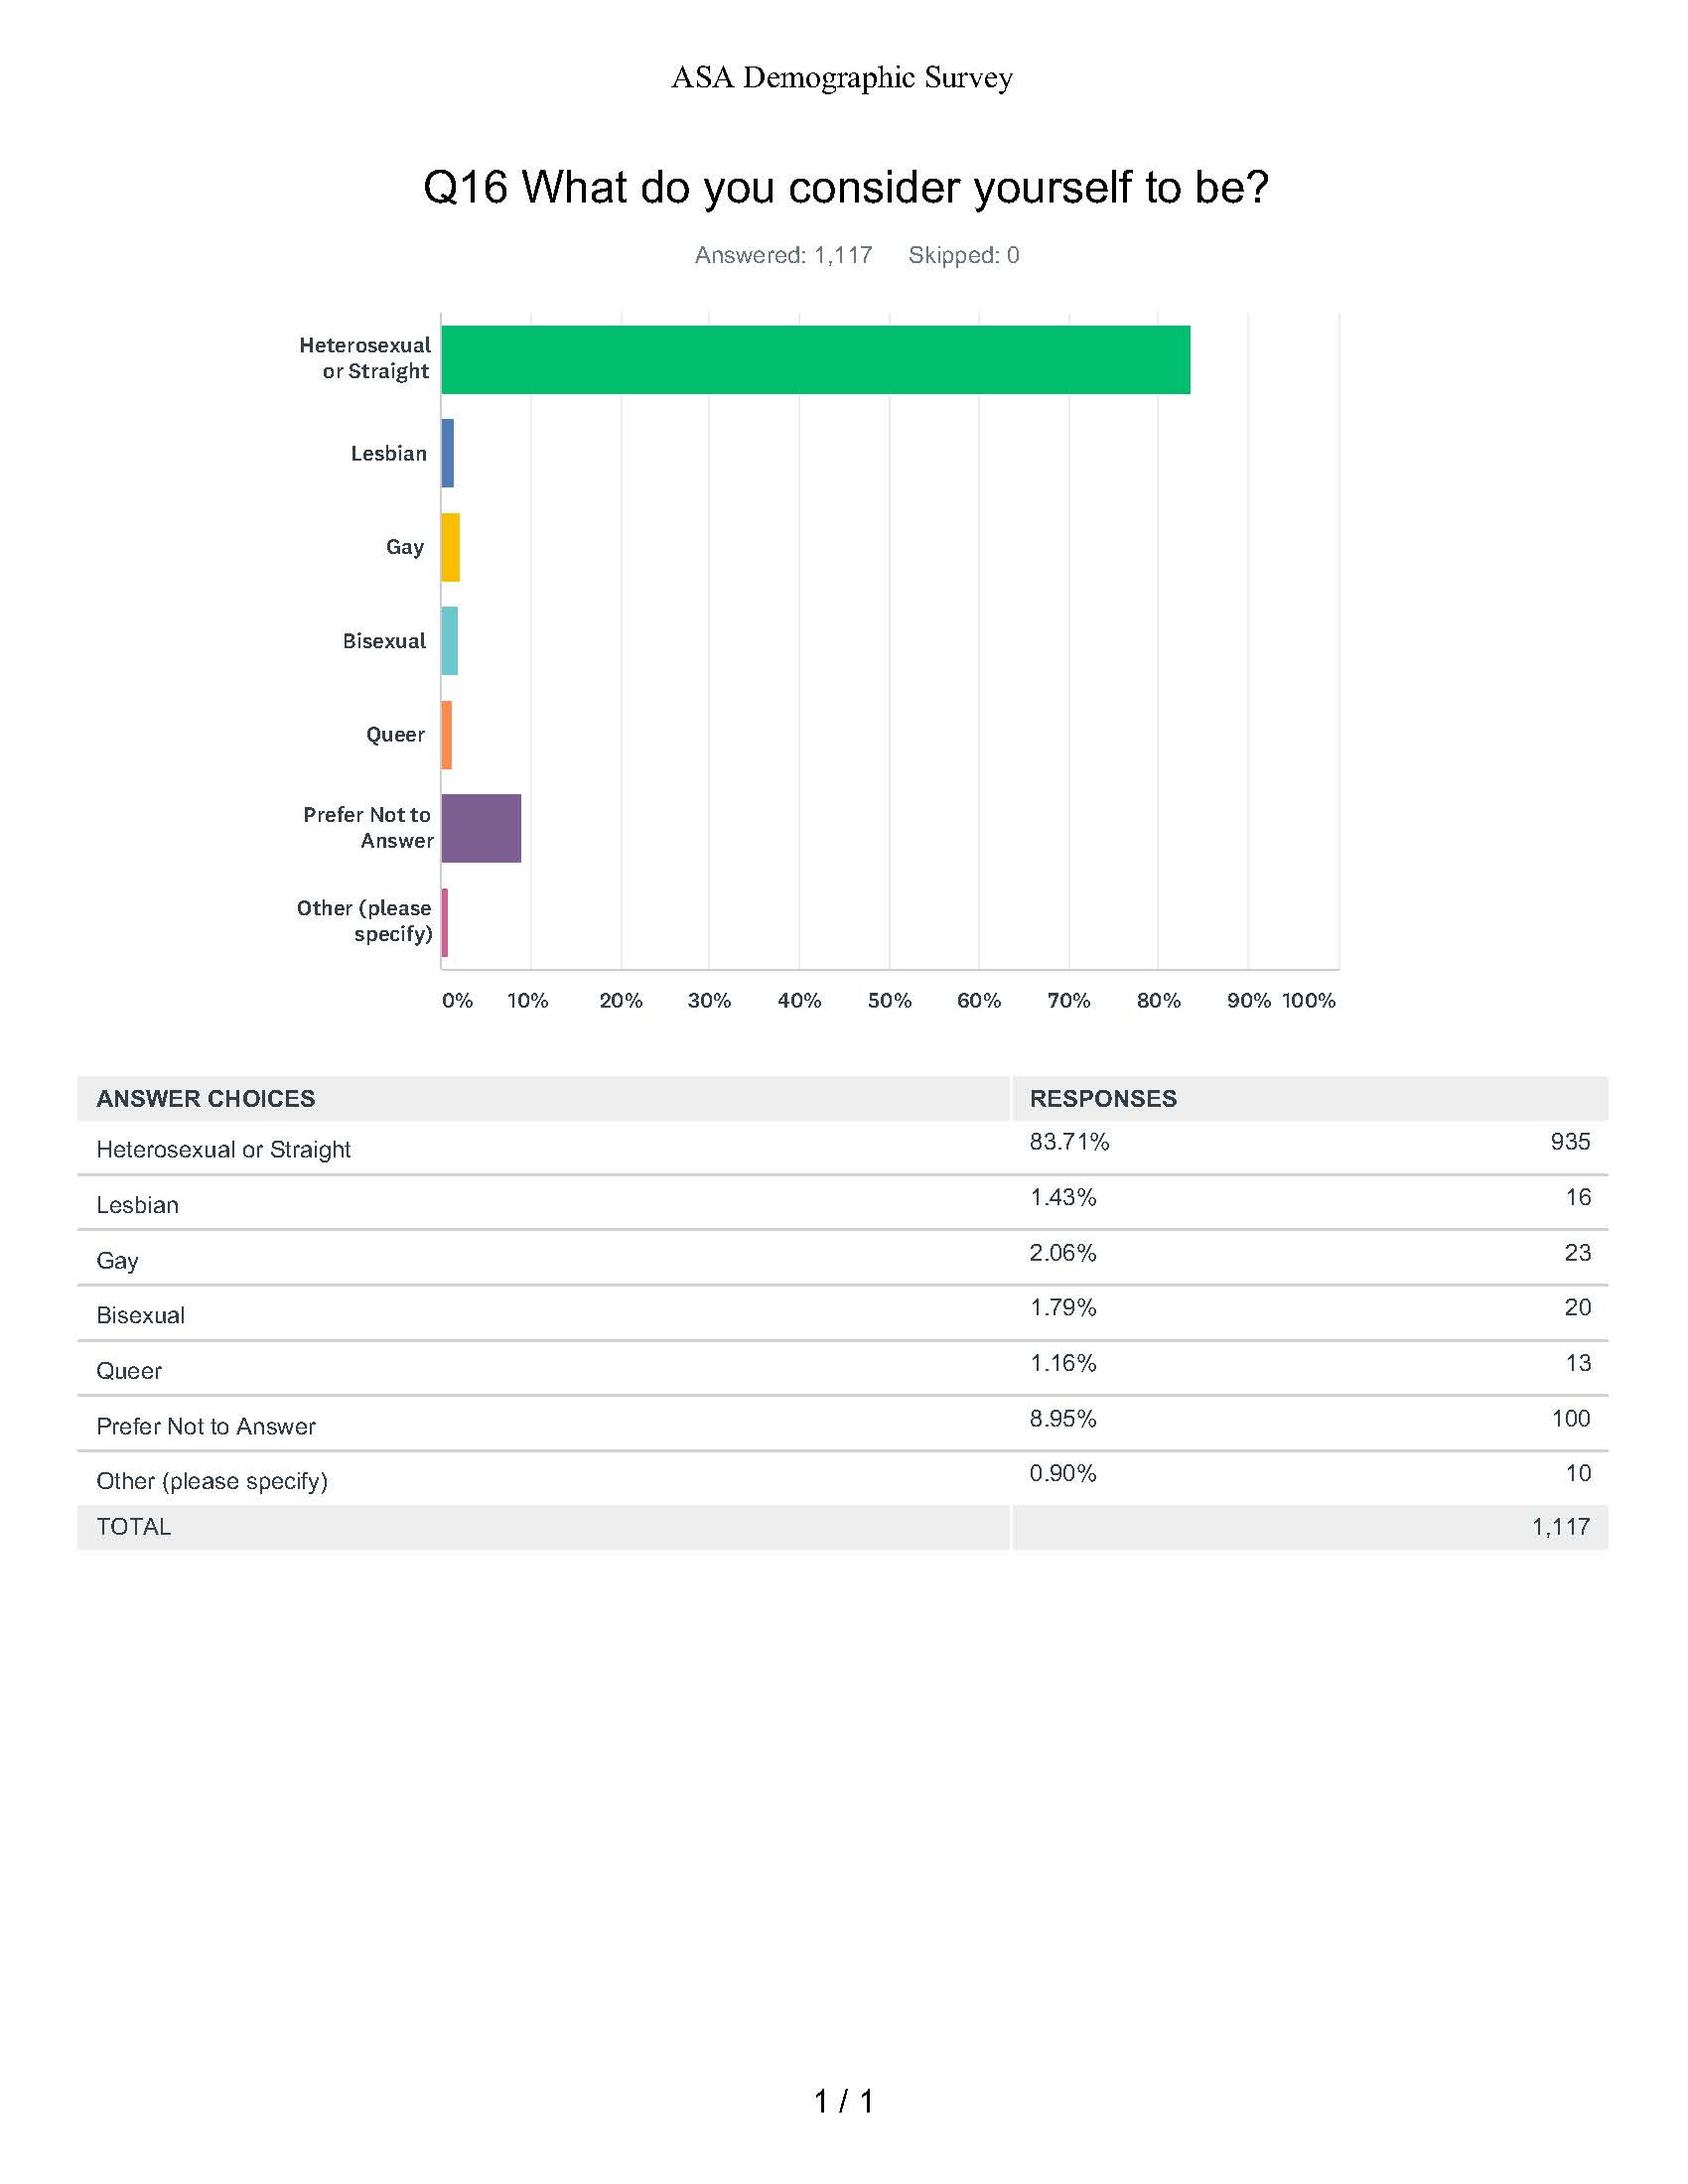
Question 16: What Do You Consider Yourself To Be
ASA 2017 Demographics
- Technical Areas
- U. S. Members by State
- International Distribution of Members
- Age Distribution
- Percentage of Men and Women Members
- Highest Academic Degree
- Subject of Highest Degree
- Professional Identification
- Employer Type
- Main Work Activity
- 13.5% Architectural Acoustics
- 12.7% Speech Communication
- 10.9% Psychological and Physiological Acoustics
- 9.3% Underwater Acoustics
- 9.2% Noise
- 9.2% Engineering Acoustics
- 8.2% Physical Acoustics
- 6.5% Signal Processing in Acoustics
- 5.2% Structural Acoustics and Vibration
- 5.1% Musical Acoustics
- 4.1% Animal Bioacoustics
- 3.9% Biomedical Acoustics
- 2.2% Acoustical Oceanography
- 14.4% CA
- 7.8% MA
- 6.8% NY
- 5.4% TX
- 4.9% MD
- 4.7% IL
- 4.4% PA
- 4.4% WA
- 4.1% VA
- 3.4% OH
- 3.3% FL
- 3.0% MI
- 33.4% others
International Distribution of Members
- 66.2 % U. S.
- 16.5 % Europe
- 8.6 % Asia
- 4.3 % Canada and Mexico
- 2.2 % Australia & New Zealand
- 1.2 % South America/Latin America
- 0.8 % Mideast/Near East
- 0.2 % Africa
- 9.9 % Under 30
- 17.4 % 30-39
- 16.5 % 40-49
- 20.2 % 50-59
- 36.0 % 60 and over
- Based on 6344 Responses
Percentage of Men and Women Members
- 17.2 % Female
- 80.4 % Male
- 2.4% No response
- 56.1 % PhD/DrSci/DrEng
- 21.1 % Masters
- 15.4 % Bachelors
- 0.7 % MD
- 3.5 % Other
- 3.2 % None
- Based on 6657 Responses
- 21.5 % Acoustics
- 12.9 % Physics
- 12.6 % Electrical Engineering
- 10.8 % Mechanical Engineering
- 5.6 % Other Engineering
- 4.6 % Speech
- 4.5 % Linguistics
- 4.2 % Psychology
- 3.7 % Audiology
- 2.6 % Math/Computer
- 2.2 % Biology
- 1.7 % Architecture
- 1.6 % Music
- 1.5 % Oceanography
- 1.3 % Neuroscience
- 1.2 % Geophysics
- 0.8 % Business Administration
- 0.7 % Physiology
- 0.1 % Education
- 4.8 % Other
- 1.1 % None
- Based on 6620 Responses
- 34.3 % Engineer
- 19.6 % Acoustician
- 11.8 % Physicist
- 5.2 % Speech Scientist
- 4.4 % Hearing Scientist
- 3.4 % Linguist
- 2.8 % Psychologist
- 2.5 % Audiologist
- 1.6 % Bioacoustician
- 1.6 % Biologist
- 1.5 % Computer Scientist
- 1.4 % Oceanographer
- 1.2 % Mathematician
- 1.1 % Geophysicist
- 1.0 % Neuroscientist
- 0.9 % Musician
- 0.8 % Architect
- 0.6 % Physician
- 0.3 % Physiologist
- 4.0 % Other
- Based on 5840 Responses
- 38.5 % College/University
- 16.9 % Self Employed Consultant
- 15.5 % Industry
- 9.2 % Govt./Govt. Funded
- 7.5 % Retired
- 5.8 % Student
- 2.7 % Contractor
- 1.9 % Not for Profit
- 2.0 % Other
- Based on 6096 Responses
- 24.7 % Applied Research
- 17.1 % Basic Research
- 15.5 % Consultant
- 12.7 % Design/Dev./Eng.
- 11.2 % Teaching
- 8.3 % Student
- 5.0 % Retired
- 1.8 % Administrative
- 0.9 % Testing
- 2.8 % Other
- Based on 6021 Responses